|
|
pylab_examples_Examples 40_contour_label_demo. |
H.Kamifuji . |
- contour_label_demo.py
等高線ラベルでできるより高度なもののいくつかを示してください。
この事例は、Windows10_1909 で Python 3.9.0 環境では、動作しません。( Z1 = mlab.bivariate_normal(X, Y, 1.0, 1.0, 0.0, 0.0) がデグレートしたのか? )
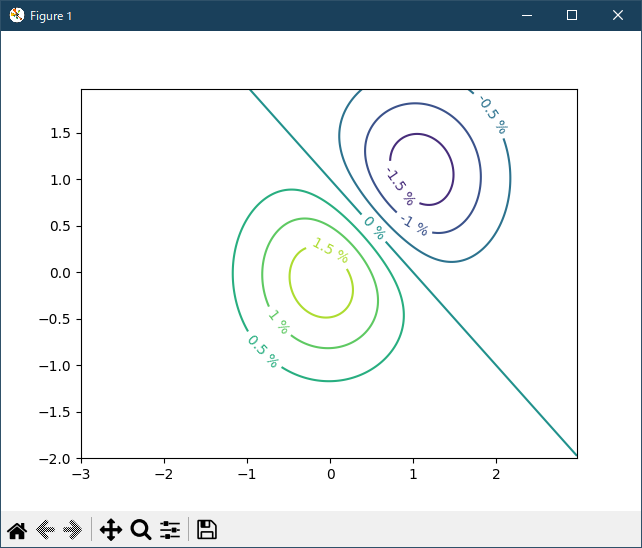
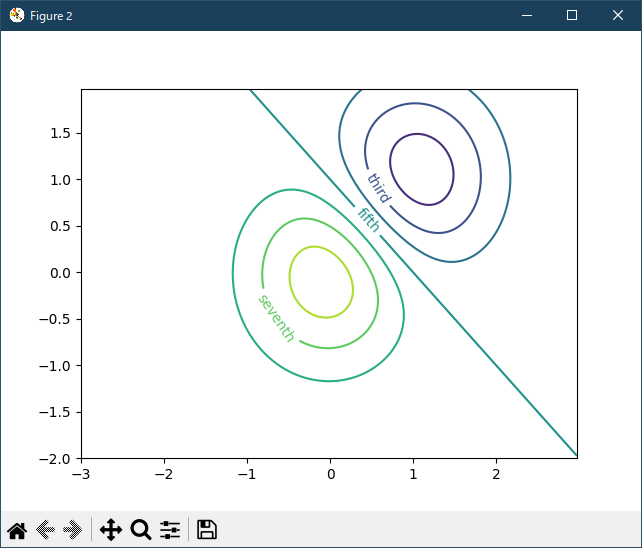
"""
Illustrate some of the more advanced things that one can do with
contour labels.

See also contour_demo.py.
"""
import matplotlib
import numpy as np
import matplotlib.cm as cm
import matplotlib.mlab as mlab
import matplotlib.ticker as ticker
import matplotlib.pyplot as plt

matplotlib.rcParams['xtick.direction'] = 'out'
matplotlib.rcParams['ytick.direction'] = 'out'

##################################################
# Define our surface
##################################################
delta = 0.025
x = np.arange(-3.0, 3.0, delta)
y = np.arange(-2.0, 2.0, delta)
X, Y = np.meshgrid(x, y)
Z1 = mlab.bivariate_normal(X, Y, 1.0, 1.0, 0.0, 0.0)
Z2 = mlab.bivariate_normal(X, Y, 1.5, 0.5, 1, 1)
# difference of Gaussians
Z = 10.0 * (Z2 - Z1)

##################################################
# Make contour labels using creative float classes
# Follows suggestion of Manuel Metz
##################################################
plt.figure()

# Basic contour plot
CS = plt.contour(X, Y, Z)


# Define a class that forces representation of float to look a certain way
# This remove trailing zero so '1.0' becomes '1'
class nf(float):
    def __repr__(self):
        str = '%.1f' % (self.__float__(),)
        if str[-1] == '0':
            return '%.0f' % self.__float__()
        else:
            return '%.1f' % self.__float__()

# Recast levels to new class
CS.levels = [nf(val) for val in CS.levels]

# Label levels with specially formatted floats
if plt.rcParams["text.usetex"]:
    fmt = r'%r \%%'
else:
    fmt = '%r %%'
plt.clabel(CS, CS.levels, inline=True, fmt=fmt, fontsize=10)

##################################################
# Label contours with arbitrary strings using a
# dictionary
##################################################
plt.figure()

# Basic contour plot
CS = plt.contour(X, Y, Z)

fmt = {}
strs = ['first', 'second', 'third', 'fourth', 'fifth', 'sixth', 'seventh']
for l, s in zip(CS.levels, strs):
    fmt[l] = s

# Label every other level using strings
plt.clabel(CS, CS.levels[::2], inline=True, fmt=fmt, fontsize=10)

# Use a Formatter

plt.figure()

CS = plt.contour(X, Y, 100**Z, locator=plt.LogLocator())
fmt = ticker.LogFormatterMathtext()
fmt.create_dummy_axis()
plt.clabel(CS, CS.levels, fmt=fmt)
plt.title("$100^Z$")

plt.show()
- 実行結果( contour_label_demo_ux.log )
当方の環境では、動作しない。出力 msg は、下記
$ py contour_label_demo.py contour_label_demo.py:24: MatplotlibDeprecationWarning: The bivariate_normal function was deprecated in Matplotlib 2.2 and will be removed in 3.1. Z1 = mlab.bivariate_normal(X, Y, 1.0, 1.0, 0.0, 0.0) contour_label_demo.py:25: MatplotlibDeprecationWarning: The bivariate_normal function was deprecated in Matplotlib 2.2 and will be removed in 3.1. Z2 = mlab.bivariate_normal(X, Y, 1.5, 0.5, 1, 1) Traceback (most recent call last): File "contour_label_demo.py", line 57, inPython 3.11.2 見直しました。上記のコードでは、下記のエラーが発生します。plt.clabel(CS, CS.levels, inline=True, fmt=fmt, fontsize=10) File "/opt/rh/rh-python36/root/usr/lib64/python3.6/site-packages/matplotlib/pyplot.py", line 2496, in clabel return gca().clabel(CS=CS, *args, **kwargs) TypeError: clabel() got multiple values for argument 'CS'
Traceback (most recent call last):
File "_:\contour_label_demo.py", line 24, in <module>
Z1 = mlab.bivariate_normal(X, Y, 1.0, 1.0, 0.0, 0.0)
^^^^^^^^^^^^^^^^^^^^^
AttributeError: module 'matplotlib.mlab' has no attribute 'bivariate_normal'
matplotlib 内部のエラーのようです。matplotlib の改修(先祖帰りバグの改修)を待つしかない。
Python 3.11.6 (matplotlib 3.7.1) では、下記のようなエラーがあり、実行できない。
Traceback (most recent call last): File "M:\______\contour_label_demo.py", line 24, in
Python 3.12.0 (matplotlib 3.8.1) では、下記のようなエラーがあり、実行できない。Z1 = mlab.bivariate_normal(X, Y, 1.0, 1.0, 0.0, 0.0) ^^^^^^^^^^^^^^^^^^^^^ AttributeError: module 'matplotlib.mlab' has no attribute 'bivariate_normal'
Traceback (most recent call last): File "E:\______\contour_label_demo.py", line 24, in
Python 3.11.6 (matplotlib 3.7.1) 及び Python 3.12.0 (matplotlib 3.8.1) で、見直し中、新しいサンプル( images-contours-and-fields-contour-label-demo-py ) を見つけ、下記のコードで、正常に実行できました。Z1 = mlab.bivariate_normal(X, Y, 1.0, 1.0, 0.0, 0.0) ^^^^^^^^^^^^^^^^^^^^^ AttributeError: module 'matplotlib.mlab' has no attribute 'bivariate_normal'
"""
==================
Contour Label Demo
==================

Illustrate some of the more advanced things that one can do with
contour labels.

See also the :doc:`contour demo example
</gallery/images_contours_and_fields/contour_demo>`.
"""

import matplotlib.pyplot as plt
import numpy as np

import matplotlib.ticker as ticker

# %%
# Define our surface

delta = 0.025
x = np.arange(-3.0, 3.0, delta)
y = np.arange(-2.0, 2.0, delta)
X, Y = np.meshgrid(x, y)
Z1 = np.exp(-X**2 - Y**2)
Z2 = np.exp(-(X - 1)**2 - (Y - 1)**2)
Z = (Z1 - Z2) * 2

# %%
# Make contour labels with custom level formatters


# This custom formatter removes trailing zeros, e.g. "1.0" becomes "1", and
# then adds a percent sign.
def fmt(x):
    s = f"{x:.1f}"
    if s.endswith("0"):
        s = f"{x:.0f}"
    return rf"{s} \%" if plt.rcParams["text.usetex"] else f"{s} %"


# Basic contour plot
fig, ax = plt.subplots()
CS = ax.contour(X, Y, Z)

ax.clabel(CS, CS.levels, inline=True, fmt=fmt, fontsize=10)

# %%
# Label contours with arbitrary strings using a dictionary

fig1, ax1 = plt.subplots()

# Basic contour plot
CS1 = ax1.contour(X, Y, Z)

fmt = {}
strs = ['first', 'second', 'third', 'fourth', 'fifth', 'sixth', 'seventh']
for l, s in zip(CS1.levels, strs):
    fmt[l] = s

# Label every other level using strings
ax1.clabel(CS1, CS1.levels[::2], inline=True, fmt=fmt, fontsize=10)

# %%
# Use a Formatter

fig2, ax2 = plt.subplots()

CS2 = ax2.contour(X, Y, 100**Z, locator=plt.LogLocator())
fmt = ticker.LogFormatterMathtext()
fmt.create_dummy_axis()
ax2.clabel(CS2, CS2.levels, fmt=fmt)
ax2.set_title("$100^Z$")

plt.show()

# %%
#
# .. admonition:: References
#
#    The use of the following functions, methods, classes and modules is shown
#    in this example:
#
#    - `matplotlib.axes.Axes.contour` / `matplotlib.pyplot.contour`
#    - `matplotlib.axes.Axes.clabel` / `matplotlib.pyplot.clabel`
#    - `matplotlib.ticker.LogFormatterMathtext`
#    - `matplotlib.ticker.TickHelper.create_dummy_axis`
Python 3.11.6 (matplotlib 3.7.1) 及び Python 3.12.0 (matplotlib 3.8.1) 共に、正常実行できる。

- 参照ページ
pylab_examples_Examples code: contour_label_demo.py
images-contours-and-fields-contour-label-demo-py
- リリースノート
- 2023/11/23 Ver=1.04 Python 3.12.0 (matplotlib 3.8.1)で確認
- 2023/11/23 Ver=1.04 Python 3.11.6 (matplotlib 3.7.1)で確認
- 2023/04/01 Ver=1.03 Python 3.11.2 で確認
- 2020/10/31 Ver=1.01 Python 3.7.8 で確認
- 2018/11/28 Ver=1.01 初版リリース
- 関連ページ