|
|
pylab_examples_Examples 38_contour_demo. |
H.Kamifuji . |
- contour_demo.py
単純な等高線描画、等高線のカラーバーで画像上の輪郭線、およびラベル付き輪郭を示します。
"""
Illustrate simple contour plotting, contours on an image with
a colorbar for the contours, and labelled contours.

See also contour_image.py.
"""
import matplotlib
import numpy as np
import matplotlib.cm as cm
import matplotlib.mlab as mlab
import matplotlib.pyplot as plt

matplotlib.rcParams['xtick.direction'] = 'out'
matplotlib.rcParams['ytick.direction'] = 'out'

delta = 0.025
x = np.arange(-3.0, 3.0, delta)
y = np.arange(-2.0, 2.0, delta)
X, Y = np.meshgrid(x, y)
Z1 = mlab.bivariate_normal(X, Y, 1.0, 1.0, 0.0, 0.0)
Z2 = mlab.bivariate_normal(X, Y, 1.5, 0.5, 1, 1)
# difference of Gaussians
Z = 10.0 * (Z2 - Z1)


# Create a simple contour plot with labels using default colors.  The
# inline argument to clabel will control whether the labels are draw
# over the line segments of the contour, removing the lines beneath
# the label
plt.figure()
CS = plt.contour(X, Y, Z)
plt.clabel(CS, inline=1, fontsize=10)
plt.title('Simplest default with labels')


# contour labels can be placed manually by providing list of positions
# (in data coordinate). See ginput_manual_clabel.py for interactive
# placement.
plt.figure()
CS = plt.contour(X, Y, Z)
manual_locations = [(-1, -1.4), (-0.62, -0.7), (-2, 0.5), (1.7, 1.2), (2.0, 1.4), (2.4, 1.7)]
plt.clabel(CS, inline=1, fontsize=10, manual=manual_locations)
plt.title('labels at selected locations')


# You can force all the contours to be the same color.
plt.figure()
CS = plt.contour(X, Y, Z, 6,
                 colors='k',  # negative contours will be dashed by default
                 )
plt.clabel(CS, fontsize=9, inline=1)
plt.title('Single color - negative contours dashed')

# You can set negative contours to be solid instead of dashed:
matplotlib.rcParams['contour.negative_linestyle'] = 'solid'
plt.figure()
CS = plt.contour(X, Y, Z, 6,
                 colors='k',  # negative contours will be dashed by default
                 )
plt.clabel(CS, fontsize=9, inline=1)
plt.title('Single color - negative contours solid')


# And you can manually specify the colors of the contour
plt.figure()
CS = plt.contour(X, Y, Z, 6,
                 linewidths=np.arange(.5, 4, .5),
                 colors=('r', 'green', 'blue', (1, 1, 0), '#afeeee', '0.5')
                 )
plt.clabel(CS, fontsize=9, inline=1)
plt.title('Crazy lines')


# Or you can use a colormap to specify the colors; the default
# colormap will be used for the contour lines
plt.figure()
im = plt.imshow(Z, interpolation='bilinear', origin='lower',
                cmap=cm.gray, extent=(-3, 3, -2, 2))
levels = np.arange(-1.2, 1.6, 0.2)
CS = plt.contour(Z, levels,
                 origin='lower',
                 linewidths=2,
                 extent=(-3, 3, -2, 2))

# Thicken the zero contour.
zc = CS.collections[6]
plt.setp(zc, linewidth=4)

plt.clabel(CS, levels[1::2],  # label every second level
           inline=1,
           fmt='%1.1f',
           fontsize=14)

# make a colorbar for the contour lines
CB = plt.colorbar(CS, shrink=0.8, extend='both')

plt.title('Lines with colorbar')
#plt.hot()  # Now change the colormap for the contour lines and colorbar
plt.flag()

# We can still add a colorbar for the image, too.
CBI = plt.colorbar(im, orientation='horizontal', shrink=0.8)

# This makes the original colorbar look a bit out of place,
# so let's improve its position.

l, b, w, h = plt.gca().get_position().bounds
ll, bb, ww, hh = CB.ax.get_position().bounds
CB.ax.set_position([ll, b + 0.1*h, ww, h*0.8])


plt.show()
- 実行結果( contour_demo_ux.log )
当方の環境では、動作しない。出力 msg は、下記
$ py contour_demo.py contour_demo.py:20: MatplotlibDeprecationWarning: The bivariate_normal function was deprecated in Matplotlib 2.2 and will be removed in 3.1. Z1 = mlab.bivariate_normal(X, Y, 1.0, 1.0, 0.0, 0.0) contour_demo.py:21: MatplotlibDeprecationWarning: The bivariate_normal function was deprecated in Matplotlib 2.2 and will be removed in 3.1. Z2 = mlab.bivariate_normal(X, Y, 1.5, 0.5, 1, 1) Traceback (most recent call last): File "contour_demo.py", line 92, inPython 3.11.2 見直しました。上記のコードでは、下記のエラーが発生します。fontsize=14) File "/opt/rh/rh-python36/root/usr/lib64/python3.6/site-packages/matplotlib/pyplot.py", line 2496, in clabel return gca().clabel(CS=CS, *args, **kwargs) TypeError: clabel() got multiple values for argument 'CS'
Traceback (most recent call last):
File "_:\contour_demo.py", line 20, in <module>
Z1 = mlab.bivariate_normal(X, Y, 1.0, 1.0, 0.0, 0.0)
^^^^^^^^^^^^^^^^^^^^^
AttributeError: module 'matplotlib.mlab' has no attribute 'bivariate_normal'
matplotlib 内部のエラーのようです。matplotlib の改修(先祖帰りバグの改修)を待つしかない。
Python 3.11.6 (matplotlib 3.7.1) では、下記のようなエラーがあり、実行できない。
Traceback (most recent call last): File "M:\______\38_contour_demo\contour_demo.py", line 20, in
Python 3.12.0 (matplotlib 3.8.1) では、下記のようなエラーがあり、実行できない。Z1 = mlab.bivariate_normal(X, Y, 1.0, 1.0, 0.0, 0.0) ^^^^^^^^^^^^^^^^^^^^^ AttributeError: module 'matplotlib.mlab' has no attribute 'bivariate_normal'
Traceback (most recent call last): File "E:\______\contour_demo.py", line 20, in
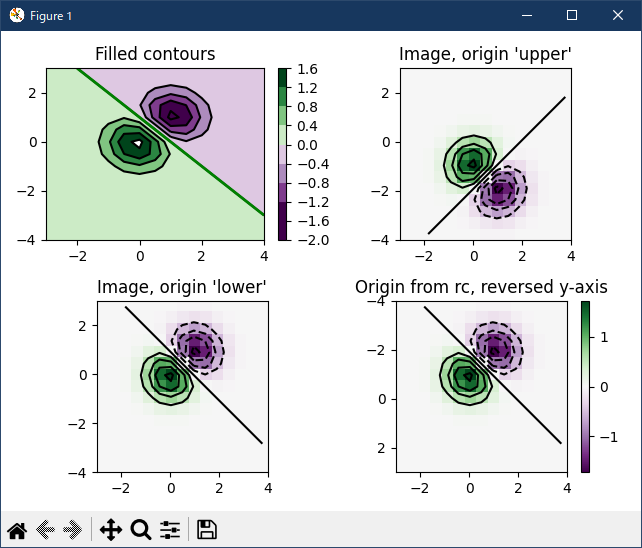
Python 3.11.6 (matplotlib 3.7.1) 及び Python 3.12.0 (matplotlib 3.8.1) で、見直し中、新しいサンプル( images-contours-and-fields-contour-image-py ) を見つけ、下記のコードで、正常に実行できました。Z1 = mlab.bivariate_normal(X, Y, 1.0, 1.0, 0.0, 0.0) ^^^^^^^^^^^^^^^^^^^^^ AttributeError: module 'matplotlib.mlab' has no attribute 'bivariate_normal'
"""
=============
Contour Image
=============

Test combinations of contouring, filled contouring, and image plotting.
For contour labelling, see also the :doc:`contour demo example
</gallery/images_contours_and_fields/contour_demo>`.

The emphasis in this demo is on showing how to make contours register
correctly on images, and on how to get both of them oriented as desired.
In particular, note the usage of the :ref:`"origin" and "extent"
<imshow_extent>` keyword arguments to imshow and
contour.
"""
import matplotlib.pyplot as plt
import numpy as np

from matplotlib import cm

# Default delta is large because that makes it fast, and it illustrates
# the correct registration between image and contours.
delta = 0.5

extent = (-3, 4, -4, 3)

x = np.arange(-3.0, 4.001, delta)
y = np.arange(-4.0, 3.001, delta)
X, Y = np.meshgrid(x, y)
Z1 = np.exp(-X**2 - Y**2)
Z2 = np.exp(-(X - 1)**2 - (Y - 1)**2)
Z = (Z1 - Z2) * 2

# Boost the upper limit to avoid truncation errors.
levels = np.arange(-2.0, 1.601, 0.4)

norm = cm.colors.Normalize(vmax=abs(Z).max(), vmin=-abs(Z).max())
cmap = cm.PRGn

fig, _axs = plt.subplots(nrows=2, ncols=2)
fig.subplots_adjust(hspace=0.3)
axs = _axs.flatten()

cset1 = axs[0].contourf(X, Y, Z, levels, norm=norm,
                        cmap=cmap.resampled(len(levels) - 1))
# It is not necessary, but for the colormap, we need only the
# number of levels minus 1.  To avoid discretization error, use
# either this number or a large number such as the default (256).

# If we want lines as well as filled regions, we need to call
# contour separately; don't try to change the edgecolor or edgewidth
# of the polygons in the collections returned by contourf.
# Use levels output from previous call to guarantee they are the same.

cset2 = axs[0].contour(X, Y, Z, cset1.levels, colors='k')

# We don't really need dashed contour lines to indicate negative
# regions, so let's turn them off.
cset2.set_linestyle('solid')

# It is easier here to make a separate call to contour than
# to set up an array of colors and linewidths.
# We are making a thick green line as a zero contour.
# Specify the zero level as a tuple with only 0 in it.

cset3 = axs[0].contour(X, Y, Z, (0,), colors='g', linewidths=2)
axs[0].set_title('Filled contours')
fig.colorbar(cset1, ax=axs[0])


axs[1].imshow(Z, extent=extent, cmap=cmap, norm=norm)
axs[1].contour(Z, levels, colors='k', origin='upper', extent=extent)
axs[1].set_title("Image, origin 'upper'")

axs[2].imshow(Z, origin='lower', extent=extent, cmap=cmap, norm=norm)
axs[2].contour(Z, levels, colors='k', origin='lower', extent=extent)
axs[2].set_title("Image, origin 'lower'")

# We will use the interpolation "nearest" here to show the actual
# image pixels.
# Note that the contour lines don't extend to the edge of the box.
# This is intentional. The Z values are defined at the center of each
# image pixel (each color block on the following subplot), so the
# domain that is contoured does not extend beyond these pixel centers.
im = axs[3].imshow(Z, interpolation='nearest', extent=extent,
                   cmap=cmap, norm=norm)
axs[3].contour(Z, levels, colors='k', origin='image', extent=extent)
ylim = axs[3].get_ylim()
axs[3].set_ylim(ylim[::-1])
axs[3].set_title("Origin from rc, reversed y-axis")
fig.colorbar(im, ax=axs[3])

fig.tight_layout()
plt.show()


# %%
#
# .. admonition:: References
#
#    The use of the following functions, methods, classes and modules is shown
#    in this example:
#
#    - `matplotlib.axes.Axes.contour` / `matplotlib.pyplot.contour`
#    - `matplotlib.axes.Axes.imshow` / `matplotlib.pyplot.imshow`
#    - `matplotlib.figure.Figure.colorbar` / `matplotlib.pyplot.colorbar`
#    - `matplotlib.colors.Normalize`
Python 3.11.6 (matplotlib 3.7.1) では、下記のようなエラーがあり、実行できない。
Traceback (most recent call last): File "M:\______\contour_image_2.py", line 59, in
Python 3.12.0 (matplotlib 3.8.1) では、正常実行です。cset2.set_linestyle('solid') ^^^^^^^^^^^^^^^^^^^ AttributeError: 'QuadContourSet' object has no attribute 'set_linestyle'
- 参照ページ
pylab_examples_Examples code: contour_demo.py
images-contours-and-fields-contour-image-py
- リリースノート
- 2023/11/23 Ver=1.04 Python 3.12.0 (matplotlib 3.8.1)で確認
- 2023/11/23 Ver=1.04 Python 3.11.6 (matplotlib 3.7.1)で確認
- 2023/04/01 Ver=1.03 Python 3.11.2 で確認
- 2020/10/31 Ver=1.01 Python 3.7.8 で確認
- 2018/11/28 Ver=1.01 初版リリース
- 関連ページ