|
|
pylab_examples_Examples 05_anchored_artists. |
H.Kamifuji . |
- anchored_artists.py
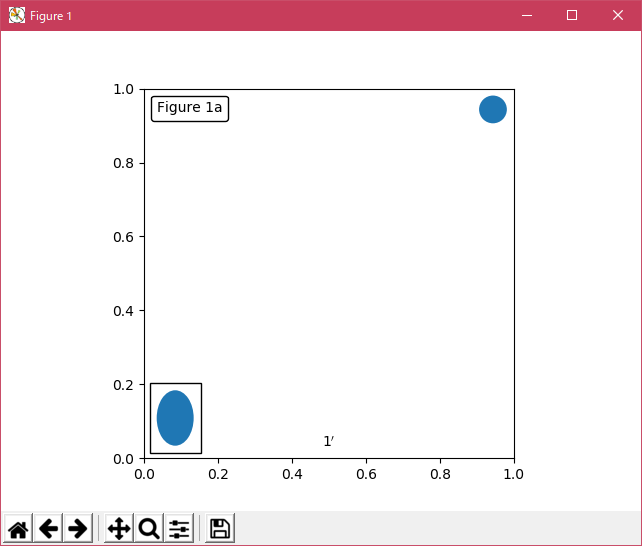
from matplotlib.patches import Rectangle, Ellipse

from matplotlib.offsetbox import AnchoredOffsetbox, AuxTransformBox, VPacker,\
    TextArea, DrawingArea


class AnchoredText(AnchoredOffsetbox):
    def __init__(self, s, loc, pad=0.4, borderpad=0.5, prop=None, frameon=True):

        self.txt = TextArea(s,
                            minimumdescent=False)

        super(AnchoredText, self).__init__(loc, pad=pad, borderpad=borderpad,
                                           child=self.txt,
                                           prop=prop,
                                           frameon=frameon)


class AnchoredSizeBar(AnchoredOffsetbox):
    def __init__(self, transform, size, label, loc,
                 pad=0.1, borderpad=0.1, sep=2, prop=None, frameon=True):
        """
        Draw a horizontal bar with the size in data coordinate of the give axes.
        A label will be drawn underneath (center-aligned).

        pad, borderpad in fraction of the legend font size (or prop)
        sep in points.
        """
        self.size_bar = AuxTransformBox(transform)
        self.size_bar.add_artist(Rectangle((0, 0), size, 0, fc="none", lw=1.0))

        self.txt_label = TextArea(label, minimumdescent=False)

        self._box = VPacker(children=[self.size_bar, self.txt_label],
                            align="center",
                            pad=0, sep=sep)

        AnchoredOffsetbox.__init__(self, loc, pad=pad, borderpad=borderpad,
                                   child=self._box,
                                   prop=prop,
                                   frameon=frameon)


class AnchoredEllipse(AnchoredOffsetbox):
    def __init__(self, transform, width, height, angle, loc,
                 pad=0.1, borderpad=0.1, prop=None, frameon=True):
        """
        Draw an ellipse the size in data coordinate of the give axes.

        pad, borderpad in fraction of the legend font size (or prop)
        """
        self._box = AuxTransformBox(transform)
        self.ellipse = Ellipse((0, 0), width, height, angle)
        self._box.add_artist(self.ellipse)

        AnchoredOffsetbox.__init__(self, loc, pad=pad, borderpad=borderpad,
                                   child=self._box,
                                   prop=prop,
                                   frameon=frameon)


class AnchoredDrawingArea(AnchoredOffsetbox):
    def __init__(self, width, height, xdescent, ydescent,
                 loc, pad=0.4, borderpad=0.5, prop=None, frameon=True):

        self.da = DrawingArea(width, height, xdescent, ydescent)

        super(AnchoredDrawingArea, self).__init__(loc, pad=pad, borderpad=borderpad,
                                                  child=self.da,
                                                  prop=None,
                                                  frameon=frameon)


if __name__ == "__main__":

    import matplotlib.pyplot as plt

    ax = plt.gca()
    ax.set_aspect(1.)

    at = AnchoredText("Figure 1a",
                      loc=2, frameon=True)
    at.patch.set_boxstyle("round,pad=0.,rounding_size=0.2")
    ax.add_artist(at)

    from matplotlib.patches import Circle
    ada = AnchoredDrawingArea(20, 20, 0, 0,
                              loc=1, pad=0., frameon=False)
    p = Circle((10, 10), 10)
    ada.da.add_artist(p)
    ax.add_artist(ada)

    # draw an ellipse of width=0.1, height=0.15 in the data coordinate
    ae = AnchoredEllipse(ax.transData, width=0.1, height=0.15, angle=0.,
                         loc=3, pad=0.5, borderpad=0.4, frameon=True)

    ax.add_artist(ae)

    # draw a horizontal bar with length of 0.1 in Data coordinate
    # (ax.transData) with a label underneath.
    asb = AnchoredSizeBar(ax.transData,
                          0.1,
                          r"1$^{\prime}$",
                          loc=8,
                          pad=0.1, borderpad=0.5, sep=5,
                          frameon=False)
    ax.add_artist(asb)

    plt.draw()
    plt.show()
- 実行結果( anchored_artists.png )
Python 3.11.2 見直しました。上記のコードでは、下記のエラーが発生します。
Traceback (most recent call last):
File "_:\anchored_artists.py", line 81, in <module>
at = AnchoredText("Figure 1a",
^^^^^^^^^^^^^^^^^^^^^^^^^
File "_:\anchored_artists.py", line 10, in <module>
self.txt = TextArea(s,
^^^^^^^^^^^
File "C:\Users\_____\AppData\Local\Programs\Python\Python311\Lib\site-packages\matplotlib\_api\deprecation.py", line 454, in wrapper
return func(*args, **kwargs)
^^^^^^^^^^^^^^^^^^^^^
TypeError: TextArea.__init__() got an unexpected keyword argument 'minimumdescent'
Python 3.11.6 (matplotlib 3.7.1) では、下記のようなエラーがあり、実行できない。
Traceback (most recent call last): File "M:\______\anchored_artists.py", line 81, in
Python 3.12.0 (matplotlib 3.8.1) では、下記のようなエラーがあり、実行できない。at = AnchoredText("Figure 1a", ^^^^^^^^^^^^^^^^^^^^^^^^^ File "M:\______\anchored_artists.py", line 10, in __init__ self.txt = TextArea(s, ^^^^^^^^^^^ File "C:\Users\______\AppData\Local\Programs\Python\Python311 \Lib\site-packages\matplotlib\_api\deprecation.py", line 454, in wrapper return func(*args, **kwargs) ^^^^^^^^^^^^^^^^^^^^^ TypeError: TextArea.__init__() got an unexpected keyword argument 'minimumdescent'
Traceback (most recent call last): File "E:\______\anchored_artists.py", line 81, in
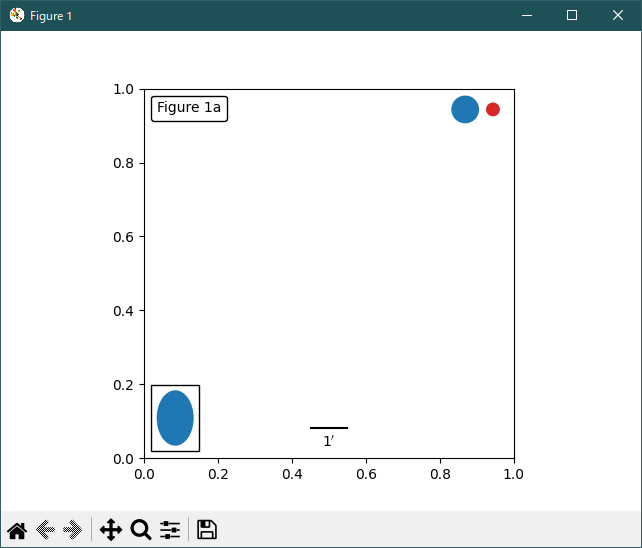
Python 3.11.6 (matplotlib 3.7.1) 及び Python 3.12.0 (matplotlib 3.8.1) で、見直し中、新しいサンプル( misc-anchored-artists-py ) を見つけ、下記のコードで、正常に実行できました。at = AnchoredText("Figure 1a", ^^^^^^^^^^^^^^^^^^^^^^^^^ File "E:\______\anchored_artists.py", line 10, in __init__ self.txt = TextArea(s, ^^^^^^^^^^^ TypeError: TextArea.__init__() got an unexpected keyword argument 'minimumdescent'
"""
================
Anchored Artists
================

This example illustrates the use of the anchored objects without the
helper classes found in :mod:`mpl_toolkits.axes_grid1`. This version
of the figure is similar to the one found in
:doc:`/gallery/axes_grid1/simple_anchored_artists`, but it is
implemented using only the matplotlib namespace, without the help
of additional toolkits.

.. redirect-from:: /gallery/userdemo/anchored_box01
.. redirect-from:: /gallery/userdemo/anchored_box02
.. redirect-from:: /gallery/userdemo/anchored_box03
"""

from matplotlib import pyplot as plt
from matplotlib.lines import Line2D
from matplotlib.offsetbox import (AnchoredOffsetbox, AuxTransformBox,
                                  DrawingArea, TextArea, VPacker)
from matplotlib.patches import Circle, Ellipse


def draw_text(ax):
    """Draw a text-box anchored to the upper-left corner of the figure."""
    box = AnchoredOffsetbox(child=TextArea("Figure 1a"),
                            loc="upper left", frameon=True)
    box.patch.set_boxstyle("round,pad=0.,rounding_size=0.2")
    ax.add_artist(box)


def draw_circles(ax):
    """Draw circles in axes coordinates."""
    area = DrawingArea(width=40, height=20)
    area.add_artist(Circle((10, 10), 10, fc="tab:blue"))
    area.add_artist(Circle((30, 10), 5, fc="tab:red"))
    box = AnchoredOffsetbox(
        child=area, loc="upper right", pad=0, frameon=False)
    ax.add_artist(box)


def draw_ellipse(ax):
    """Draw an ellipse of width=0.1, height=0.15 in data coordinates."""
    aux_tr_box = AuxTransformBox(ax.transData)
    aux_tr_box.add_artist(Ellipse((0, 0), width=0.1, height=0.15))
    box = AnchoredOffsetbox(child=aux_tr_box, loc="lower left", frameon=True)
    ax.add_artist(box)


def draw_sizebar(ax):
    """
    Draw a horizontal bar with length of 0.1 in data coordinates,
    with a fixed label center-aligned underneath.
    """
    size = 0.1
    text = r"1$^{\prime}$"
    sizebar = AuxTransformBox(ax.transData)
    sizebar.add_artist(Line2D([0, size], [0, 0], color="black"))
    text = TextArea(text)
    packer = VPacker(
        children=[sizebar, text], align="center", sep=5)  # separation in points.
    ax.add_artist(AnchoredOffsetbox(
        child=packer, loc="lower center", frameon=False,
        pad=0.1, borderpad=0.5))  # paddings relative to the legend fontsize.


fig, ax = plt.subplots()
ax.set_aspect(1)

draw_text(ax)
draw_circles(ax)
draw_ellipse(ax)
draw_sizebar(ax)

plt.show()
Python 3.11.6 (matplotlib 3.7.1) 及び Python 3.12.0 (matplotlib 3.8.1) 共に、正常実行です。
- 参照ページ
pylab_examples_Examples code: anchored_artists.py
misc-anchored-artists-py
- リリースノート
- 2023/11/21 Ver=1.04 Python 3.12.0 (matplotlib 3.8.1)で確認
- 2023/11/21 Ver=1.04 Python 3.11.6 (matplotlib 3.7.1)で確認
- 2023/04/01 Ver=1.03 Python 3.11.2 で確認
- 2020/10/31 Ver=1.01 Python 3.7.8 で確認
- 2018/11/28 Ver=1.01 初版リリース
- 関連ページ