|
|
pylab_examples_Examples 01_accented_text. |
H.Kamifuji . |
- accented_text.py
matplotlib は TeX mathtext を介してアクセント付き文字をサポートしています
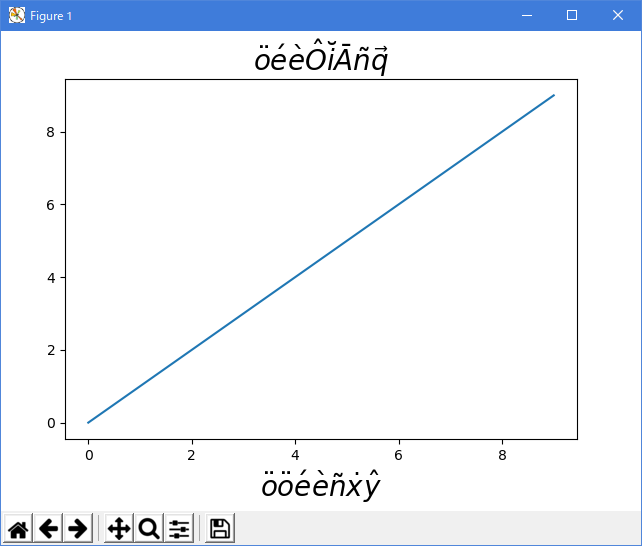
\hat、\breve、\grave、\bar、\acute、\tilde、\vec、\dot、\ddot のアクセントが提供されています。 それらはすべて、例えば \bar {o} を行うオーバーバーを作成するか、\ddot {o} を実行するウムラウトを作成するための構文と同じです。 ショートカットも提供されています(例:\"o \'e \`e \?n \.x \^y
r"""
matplotlib supports accented characters via TeX mathtext

The following accents are provided: \hat, \breve, \grave, \bar,
\acute, \tilde, \vec, \dot, \ddot.  All of them have the same syntax,
e.g., to make an overbar you do \bar{o} or to make an o umlaut you do
\ddot{o}.  The shortcuts are also provided, e.g.,: \"o \'e \`e \~n \.x
\^y

"""
import matplotlib.pyplot as plt

plt.axes([0.1, 0.15, 0.8, 0.75])
plt.plot(range(10))

plt.title(r'$\ddot{o}\acute{e}\grave{e}\hat{O}\breve{i}\bar{A}\tilde{n}\vec{q}$', fontsize=20)
# shorthand is also supported and curly's are optional
plt.xlabel(r"""$\"o\ddot o \'e\`e\~n\.x\^y$""", fontsize=20)


plt.show()
- 実行結果( accented_text.png )
- 参照ページ
pylab_examples_Examples code: accented_text.py
- リリースノート
- 2023/04/01 Ver=1.03 Python 3.11.2 で確認
- 2020/10/31 Ver=1.01 Python 3.7.8 で確認
- 2018/11/28 Ver=1.01 初版リリース
- 関連ページ