|
pie_and_polar_charts_Examples 03_polar_scatter_demo. |
H.Kamifuji . |
- polar_scatter_demo.py
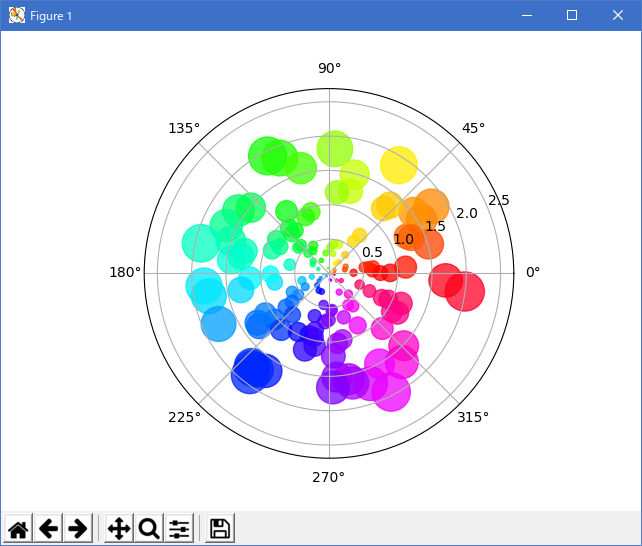
極軸上の散布図のデモ。
この例では、半径方向にサイズが大きくなり、角度によって色が増えます(シンボルが正しく散在していることを確認するだけです)。
"""
==========================
Scatter plot on polar axis
==========================

Demo of scatter plot on a polar axis.

Size increases radially in this example and color increases with angle
(just to verify the symbols are being scattered correctly).
"""
import numpy as np
import matplotlib.pyplot as plt


# Compute areas and colors
N = 150
r = 2 * np.random.rand(N)
theta = 2 * np.pi * np.random.rand(N)
area = 200 * r**2
colors = theta

ax = plt.subplot(111, projection='polar')
c = ax.scatter(theta, r, c=colors, s=area, cmap='hsv', alpha=0.75)

plt.show()
- 実行結果( polar_scatter_demo.png )

- 参照ページ
pie_and_polar_charts_Examples code: pie_demo_polar_scatter_demo.py
- リリースノート
- 2023/04/01 Ver=1.03 Python 3.11.2 で確認
- 2020/10/31 Ver=1.01 Python 3.7.8 で確認
- 2018/11/28 Ver=1.01 初版リリース
- 関連ページ