|
|
matplotlib mplot3d_Examples 26_tricontourf3d_demo. |
H.Kamifuji . |
- tricontourf3d_demo.py
非構造化三角形グリッドの塗りつぶした等高線図。
使用されるデータは、trisurf3d_demo2 の 2 番目のプロットと同じです。 tricontour3d_demo は、この例の埋められていないバージョンを示しています。
"""
=================================
Triangular 3D filled contour plot
=================================

Filled contour plots of unstructured triangular grids.

The data used is the same as in the second plot of trisurf3d_demo2.
tricontour3d_demo shows the unfilled version of this example.
"""

import matplotlib.pyplot as plt
from mpl_toolkits.mplot3d import Axes3D
import matplotlib.tri as tri
import numpy as np

# First create the x, y, z coordinates of the points.
n_angles = 48
n_radii = 8
min_radius = 0.25

# Create the mesh in polar coordinates and compute x, y, z.
radii = np.linspace(min_radius, 0.95, n_radii)
angles = np.linspace(0, 2*np.pi, n_angles, endpoint=False)
angles = np.repeat(angles[..., np.newaxis], n_radii, axis=1)
angles[:, 1::2] += np.pi/n_angles

x = (radii*np.cos(angles)).flatten()
y = (radii*np.sin(angles)).flatten()
z = (np.cos(radii)*np.cos(angles*3.0)).flatten()

# Create a custom triangulation.
triang = tri.Triangulation(x, y)

# Mask off unwanted triangles.
xmid = x[triang.triangles].mean(axis=1)
ymid = y[triang.triangles].mean(axis=1)
mask = np.where(xmid*xmid + ymid*ymid < min_radius*min_radius, 1, 0)
triang.set_mask(mask)

fig = plt.figure()
ax = fig.gca(projection='3d')
ax.tricontourf(triang, z, cmap=plt.cm.CMRmap)

# Customize the view angle so it's easier to understand the plot.
ax.view_init(elev=45.)

plt.show()
- 実行結果( tricontourf3d_demo.png )
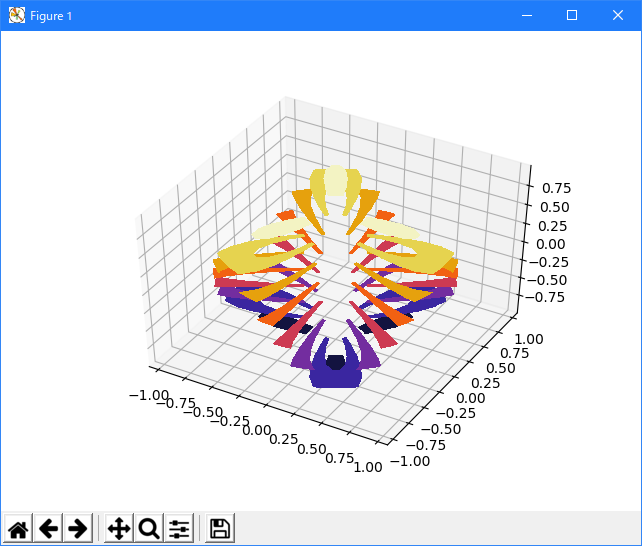
Python 3.11.2 見直しました。上記のコードでは、下記のエラーが発生します。
Traceback (most recent call last):
File "_:\tricontourf3d_demo.py", line 42, in <module>
ax = fig.gca(projection='3d')
^^^^^^^^^^^^^^^^^^^^^^^^
TypeError: FigureBase.gca() got an unexpected keyword argument 'projection'
matplotlib 内部のエラーのようです。matplotlib の改修(先祖帰りバグの改修)を待つしかない。
Python 3.11.6 (matplotlib 3.7.1) では、下記のようなエラーがあり、実行できない。
Traceback (most recent call last): File "M:\______\tricontourf3d_demo.py", line 42, in
Python 3.12.0 (matplotlib 3.8.1) では、下記のようなエラーがあり、実行できない。ax = fig.gca(projection='3d') ^^^^^^^^^^^^^^^^^^^^^^^^ TypeError: FigureBase.gca() got an unexpected keyword argument 'projection'
Traceback (most recent call last): File "E:\______\tricontourf3d_demo.py", line 42, in
Python 3.11.6 (matplotlib 3.7.1) 及び Python 3.12.0 (matplotlib 3.8.1) で、見直し中、新しいサンプル( mplot3d-tricontourf3d-py ) を見つけ、下記のコードで、正常に実行できました。ax = fig.gca(projection='3d') ^^^^^^^^^^^^^^^^^^^^^^^^ TypeError: FigureBase.gca() got an unexpected keyword argument 'projection'
"""
=================================
Triangular 3D filled contour plot
=================================

Filled contour plots of unstructured triangular grids.

The data used is the same as in the second plot of :doc:`trisurf3d_2`.
:doc:`tricontour3d` shows the unfilled version of this example.
"""

import matplotlib.pyplot as plt
import numpy as np

import matplotlib.tri as tri

# First create the x, y, z coordinates of the points.
n_angles = 48
n_radii = 8
min_radius = 0.25

# Create the mesh in polar coordinates and compute x, y, z.
radii = np.linspace(min_radius, 0.95, n_radii)
angles = np.linspace(0, 2*np.pi, n_angles, endpoint=False)
angles = np.repeat(angles[..., np.newaxis], n_radii, axis=1)
angles[:, 1::2] += np.pi/n_angles

x = (radii*np.cos(angles)).flatten()
y = (radii*np.sin(angles)).flatten()
z = (np.cos(radii)*np.cos(3*angles)).flatten()

# Create a custom triangulation.
triang = tri.Triangulation(x, y)

# Mask off unwanted triangles.
triang.set_mask(np.hypot(x[triang.triangles].mean(axis=1),
                         y[triang.triangles].mean(axis=1))
                < min_radius)

ax = plt.figure().add_subplot(projection='3d')
ax.tricontourf(triang, z, cmap=plt.cm.CMRmap)

# Customize the view angle so it's easier to understand the plot.
ax.view_init(elev=45.)

plt.show()
Python 3.11.6 (matplotlib 3.7.1) 及び Python 3.12.0 (matplotlib 3.8.1) 共に、正常実行です。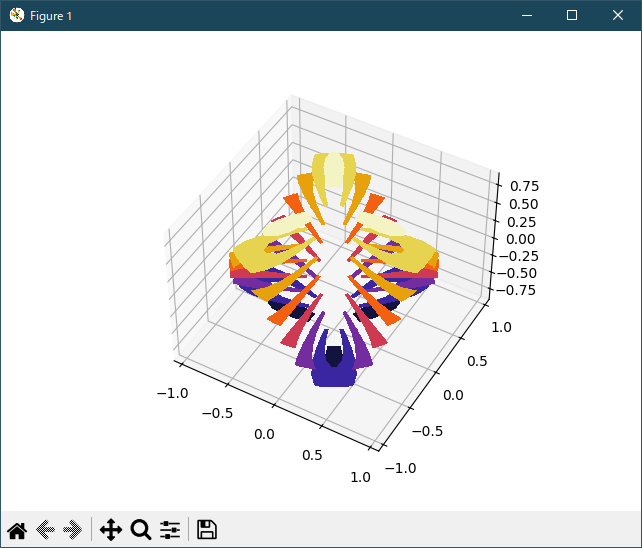
- 参照ページ
mplot3d_Examples code: tricontourf3d_demo.py
mplot3d-tricontourf3d-py
- リリースノート
- 2023/11/20 Ver=1.04 Python 3.12.0 (matplotlib 3.8.1)で確認
- 2023/11/20 Ver=1.04 Python 3.11.6 (matplotlib 3.7.1)で確認
- 2023/04/01 Ver=1.03 Python 3.11.2 で確認
- 2020/10/30 Ver=1.01 Python 3.7.8 で確認
- 2018/11/28 Ver=1.01 初版リリース
- 関連ページ