|
|
matplotlib mplot3d_Examples 22_surface3d_demo3. |
H.Kamifuji . |
- surface3d_demo3.py
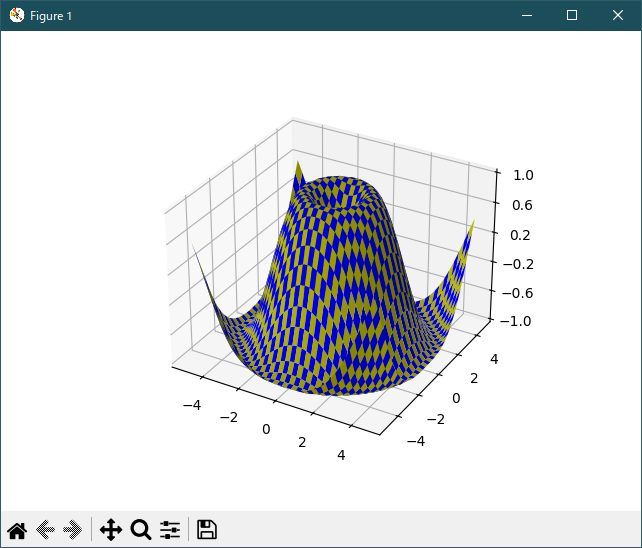
チェッカーボードのパターンで 3D サーフェスを描画する方法を示します。
'''
=========================
3D surface (checkerboard)
=========================

Demonstrates plotting a 3D surface colored in a checkerboard pattern.
'''

from mpl_toolkits.mplot3d import Axes3D
import matplotlib.pyplot as plt
from matplotlib import cm
from matplotlib.ticker import LinearLocator
import numpy as np


fig = plt.figure()
ax = fig.gca(projection='3d')

# Make data.
X = np.arange(-5, 5, 0.25)
xlen = len(X)
Y = np.arange(-5, 5, 0.25)
ylen = len(Y)
X, Y = np.meshgrid(X, Y)
R = np.sqrt(X**2 + Y**2)
Z = np.sin(R)

# Create an empty array of strings with the same shape as the meshgrid, and
# populate it with two colors in a checkerboard pattern.
colortuple = ('y', 'b')
colors = np.empty(X.shape, dtype=str)
for y in range(ylen):
    for x in range(xlen):
        colors[x, y] = colortuple[(x + y) % len(colortuple)]

# Plot the surface with face colors taken from the array we made.
surf = ax.plot_surface(X, Y, Z, facecolors=colors, linewidth=0)

# Customize the z axis.
ax.set_zlim(-1, 1)
ax.w_zaxis.set_major_locator(LinearLocator(6))

plt.show()
- 実行結果( surface3d_demo3.png )

Python 3.11.2 見直しました。上記のコードでは、下記のエラーが発生します。
Traceback (most recent call last):
File "_:\surface3d_demo3.py", line 17, in <module>
ax = fig.gca(projection='3d')
^^^^^^^^^^^^^^^^^^^^^^^^
TypeError: FigureBase.gca() got an unexpected keyword argument 'projection'
matplotlib 内部のエラーのようです。matplotlib の改修(先祖帰りバグの改修)を待つしかない。
Python 3.11.6 (matplotlib 3.7.1) では、下記のようなエラーがあり、実行できない。
Traceback (most recent call last): File "M:\______\surface3d_demo3.py", line 17, in
Python 3.12.0 (matplotlib 3.8.1) では、下記のようなエラーがあり、実行できない。ax = fig.gca(projection='3d') ^^^^^^^^^^^^^^^^^^^^^^^^ TypeError: FigureBase.gca() got an unexpected keyword argument 'projection'
Traceback (most recent call last): File "E:\______\surface3d_demo3.py", line 17, in
Python 3.11.6 (matplotlib 3.7.1) 及び Python 3.12.0 (matplotlib 3.8.1) で、見直し中、新しいサンプル( mplot3d-surface3d-3-py ) を見つけ、下記のコードで、正常に実行できました。ax = fig.gca(projection='3d') ^^^^^^^^^^^^^^^^^^^^^^^^ TypeError: FigureBase.gca() got an unexpected keyword argument 'projection'
"""
=========================
3D surface (checkerboard)
=========================

Demonstrates plotting a 3D surface colored in a checkerboard pattern.
"""

import matplotlib.pyplot as plt
import numpy as np

from matplotlib.ticker import LinearLocator

ax = plt.figure().add_subplot(projection='3d')

# Make data.
X = np.arange(-5, 5, 0.25)
xlen = len(X)
Y = np.arange(-5, 5, 0.25)
ylen = len(Y)
X, Y = np.meshgrid(X, Y)
R = np.sqrt(X**2 + Y**2)
Z = np.sin(R)

# Create an empty array of strings with the same shape as the meshgrid, and
# populate it with two colors in a checkerboard pattern.
colortuple = ('y', 'b')
colors = np.empty(X.shape, dtype=str)
for y in range(ylen):
    for x in range(xlen):
        colors[y, x] = colortuple[(x + y) % len(colortuple)]

# Plot the surface with face colors taken from the array we made.
surf = ax.plot_surface(X, Y, Z, facecolors=colors, linewidth=0)

# Customize the z axis.
ax.set_zlim(-1, 1)
ax.zaxis.set_major_locator(LinearLocator(6))

plt.show()
Python 3.11.6 (matplotlib 3.7.1) 及び Python 3.12.0 (matplotlib 3.8.1) 共に、正常実行です。
- 参照ページ
mplot3d_Examples code: surface3d_demo3.py
mplot3d-surface3d-3-py
- リリースノート
- 2023/11/20 Ver=1.04 Python 3.12.0 (matplotlib 3.8.1)で確認
- 2023/11/20 Ver=1.04 Python 3.11.6 (matplotlib 3.7.1)で確認
- 2023/04/01 Ver=1.03 Python 3.11.2 で確認
- 2020/10/30 Ver=1.01 Python 3.7.8 で確認
- 2018/11/28 Ver=1.01 初版リリース
- 関連ページ