|
|
matplotlib mplot3d_Examples 16_quiver3d_demo. |
H.Kamifuji . |
- quiver3d_demo.py
3d meshgrid 上の点に方向性の矢印をプロットしています。
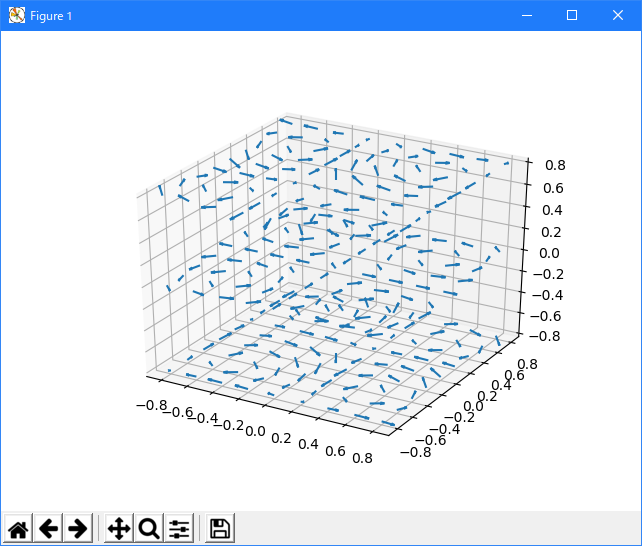
'''
==============
3D quiver plot
==============

Demonstrates plotting directional arrows at points on a 3d meshgrid.
'''

from mpl_toolkits.mplot3d import axes3d
import matplotlib.pyplot as plt
import numpy as np

fig = plt.figure()
ax = fig.gca(projection='3d')

# Make the grid
x, y, z = np.meshgrid(np.arange(-0.8, 1, 0.2),
                      np.arange(-0.8, 1, 0.2),
                      np.arange(-0.8, 1, 0.8))

# Make the direction data for the arrows
u = np.sin(np.pi * x) * np.cos(np.pi * y) * np.cos(np.pi * z)
v = -np.cos(np.pi * x) * np.sin(np.pi * y) * np.cos(np.pi * z)
w = (np.sqrt(2.0 / 3.0) * np.cos(np.pi * x) * np.cos(np.pi * y) *
     np.sin(np.pi * z))

ax.quiver(x, y, z, u, v, w, length=0.1, normalize=True)

plt.show()
- 実行結果( quiver3d_demo.png )
Python 3.11.2 見直しました。上記のコードでは、下記のエラーが発生します。
Traceback (most recent call last):
File "_:\quiver3d_demo.py", line 14, in <module>
ax = fig.gca(projection='3d')
^^^^^^^^^^^^^^^^^^^^^^^^
TypeError: FigureBase.gca() got an unexpected keyword argument 'projection'
matplotlib 内部のエラーのようです。matplotlib の改修(先祖帰りバグの改修)を待つしかない。
Python 3.11.6 (matplotlib 3.7.1) では、下記のようなエラーがあり、実行できない。
Traceback (most recent call last): File "M:\______\quiver3d_demo.py", line 14, in
Python 3.12.0 (matplotlib 3.8.1) では、下記のようなエラーがあり、実行できない。ax = fig.gca(projection='3d') ^^^^^^^^^^^^^^^^^^^^^^^^ TypeError: FigureBase.gca() got an unexpected keyword argument 'projection'
Traceback (most recent call last): File "E:\______\quiver3d_demo.py", line 14, in
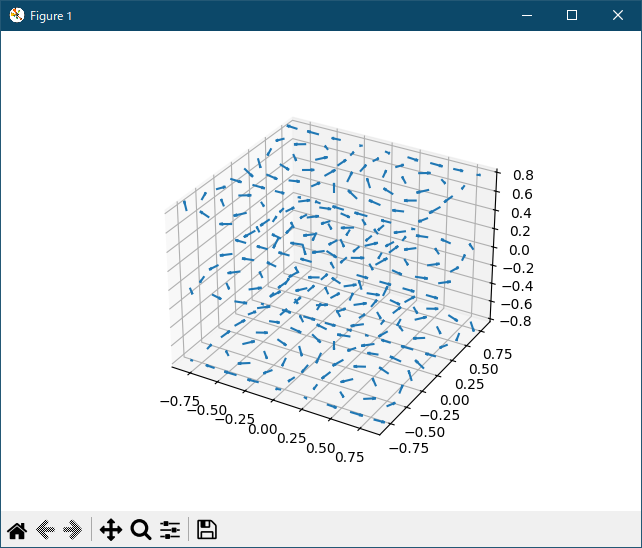
Python 3.11.6 (matplotlib 3.7.1) 及び Python 3.12.0 (matplotlib 3.8.1) で、見直し中、新しいサンプル( mplot3d-quiver3d-py ) を見つけ、下記のコードで、正常に実行できました。ax = fig.gca(projection='3d') ^^^^^^^^^^^^^^^^^^^^^^^^ TypeError: FigureBase.gca() got an unexpected keyword argument 'projection'
"""
==============
3D quiver plot
==============

Demonstrates plotting directional arrows at points on a 3D meshgrid.
"""

import matplotlib.pyplot as plt
import numpy as np

ax = plt.figure().add_subplot(projection='3d')

# Make the grid
x, y, z = np.meshgrid(np.arange(-0.8, 1, 0.2),
                      np.arange(-0.8, 1, 0.2),
                      np.arange(-0.8, 1, 0.8))

# Make the direction data for the arrows
u = np.sin(np.pi * x) * np.cos(np.pi * y) * np.cos(np.pi * z)
v = -np.cos(np.pi * x) * np.sin(np.pi * y) * np.cos(np.pi * z)
w = (np.sqrt(2.0 / 3.0) * np.cos(np.pi * x) * np.cos(np.pi * y) *
     np.sin(np.pi * z))

ax.quiver(x, y, z, u, v, w, length=0.1, normalize=True)

plt.show()
Python 3.11.6 (matplotlib 3.7.1) 及び Python 3.12.0 (matplotlib 3.8.1) 共に、正常実行です。
- 参照ページ
mplot3d_Examples code: quiver3d_demo.py
mplot3d-quiver3d-py
- リリースノート
- 2023/11/19 Ver=1.04 Python 3.12.0 (matplotlib 3.8.1)で確認
- 2023/11/19 Ver=1.04 Python 3.11.6 (matplotlib 3.7.1)で確認
- 2023/04/01 Ver=1.03 Python 3.11.2 で確認
- 2020/10/30 Ver=1.01 Python 3.7.8 で確認
- 2018/11/28 Ver=1.01 初版リリース
- 関連ページ