|
|
matplotlib mplot3d_Examples 15_polys3d_demo. |
H.Kamifuji . |
- polys3d_demo.py
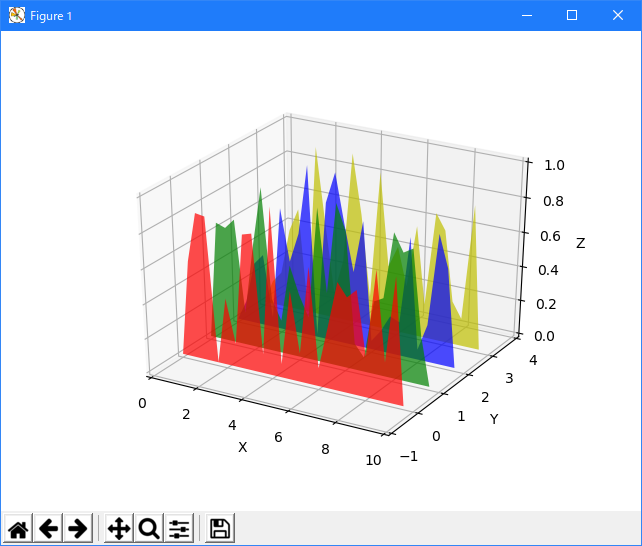
線グラフの下のスペースを埋めるポリゴンを作成する方法を示します。 この例では、ポリゴンは半透明で、「ギザギザのステンドグラス」エフェクトを作成します。
"""
=============================================
Generate polygons to fill under 3D line graph
=============================================

Demonstrate how to create polygons which fill the space under a line
graph. In this example polygons are semi-transparent, creating a sort
of 'jagged stained glass' effect.
"""

from mpl_toolkits.mplot3d import Axes3D
from matplotlib.collections import PolyCollection
import matplotlib.pyplot as plt
from matplotlib import colors as mcolors
import numpy as np


fig = plt.figure()
ax = fig.gca(projection='3d')


def cc(arg):
    return mcolors.to_rgba(arg, alpha=0.6)

xs = np.arange(0, 10, 0.4)
verts = []
zs = [0.0, 1.0, 2.0, 3.0]
for z in zs:
    ys = np.random.rand(len(xs))
    ys[0], ys[-1] = 0, 0
    verts.append(list(zip(xs, ys)))

poly = PolyCollection(verts, facecolors=[cc('r'), cc('g'), cc('b'),
                                         cc('y')])
poly.set_alpha(0.7)
ax.add_collection3d(poly, zs=zs, zdir='y')

ax.set_xlabel('X')
ax.set_xlim3d(0, 10)
ax.set_ylabel('Y')
ax.set_ylim3d(-1, 4)
ax.set_zlabel('Z')
ax.set_zlim3d(0, 1)

plt.show()
- 実行結果( polys3d_demo.png )
Python 3.11.2 見直しました。上記のコードでは、下記のエラーが発生します。
Traceback (most recent call last):
File "_:\polys3d_demo.py", line 19, in <module>
ax = fig.gca(projection='3d')
^^^^^^^^^^^^^^^^^^^^^^^^
TypeError: FigureBase.gca() got an unexpected keyword argument 'projection'
matplotlib 内部のエラーのようです。matplotlib の改修(先祖帰りバグの改修)を待つしかない。
Python 3.11.6 (matplotlib 3.7.1) では、下記のようなエラーがあり、実行できない。
Traceback (most recent call last): File "M:\______\polys3d_demo.py", line 19, in
Python 3.12.0 (matplotlib 3.8.1) では、下記のようなエラーがあり、実行できない。ax = fig.gca(projection='3d') ^^^^^^^^^^^^^^^^^^^^^^^^ TypeError: FigureBase.gca() got an unexpected keyword argument 'projection'
Traceback (most recent call last): File "E:\______\polys3d_demo.py", line 19, in
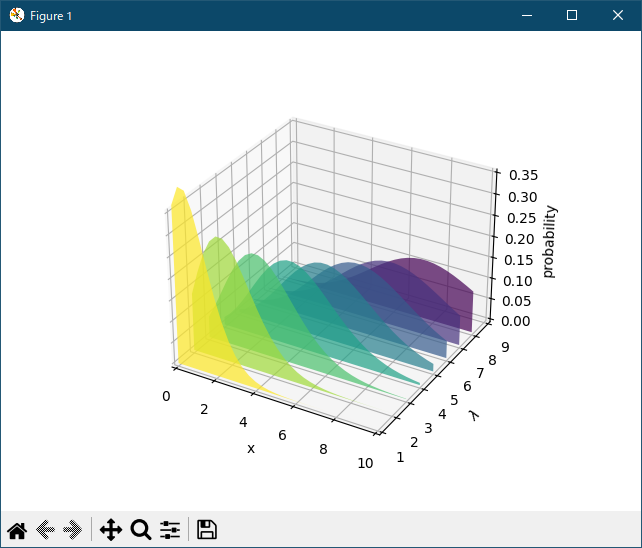
Python 3.11.6 (matplotlib 3.7.1) 及び Python 3.12.0 (matplotlib 3.8.1) で、見直し中、新しいサンプル( mplot3d-polys3d-py ) を見つけ、下記のコードで、正常に実行できました。ax = fig.gca(projection='3d') ^^^^^^^^^^^^^^^^^^^^^^^^ TypeError: FigureBase.gca() got an unexpected keyword argument 'projection'
"""
=============================================
Generate polygons to fill under 3D line graph
=============================================

Demonstrate how to create polygons which fill the space under a line
graph. In this example polygons are semi-transparent, creating a sort
of 'jagged stained glass' effect.
"""

import math

import matplotlib.pyplot as plt
import numpy as np

from matplotlib.collections import PolyCollection

# Fixing random state for reproducibility
np.random.seed(19680801)


def polygon_under_graph(x, y):
    """
    Construct the vertex list which defines the polygon filling the space under
    the (x, y) line graph. This assumes x is in ascending order.
    """
    return [(x[0], 0.), *zip(x, y), (x[-1], 0.)]


ax = plt.figure().add_subplot(projection='3d')

x = np.linspace(0., 10., 31)
lambdas = range(1, 9)

# verts[i] is a list of (x, y) pairs defining polygon i.
gamma = np.vectorize(math.gamma)
verts = [polygon_under_graph(x, l**x * np.exp(-l) / gamma(x + 1))
         for l in lambdas]
facecolors = plt.colormaps['viridis_r'](np.linspace(0, 1, len(verts)))

poly = PolyCollection(verts, facecolors=facecolors, alpha=.7)
ax.add_collection3d(poly, zs=lambdas, zdir='y')

ax.set(xlim=(0, 10), ylim=(1, 9), zlim=(0, 0.35),
       xlabel='x', ylabel=r'$\lambda$', zlabel='probability')

plt.show()
Python 3.11.6 (matplotlib 3.7.1) 及び Python 3.12.0 (matplotlib 3.8.1) 共に、正常実行です。
- 参照ページ
mplot3d_Examples code: polys3d_demo.py
mplot3d-polys3d-py
- リリースノート
- 2023/11/19 Ver=1.04 Python 3.12.0 (matplotlib 3.8.1)で確認
- 2023/11/19 Ver=1.04 Python 3.11.6 (matplotlib 3.7.1)で確認
- 2023/04/01 Ver=1.03 Python 3.11.2 で確認
- 2020/10/30 Ver=1.01 Python 3.7.8 で確認
- 2018/11/28 Ver=1.01 初版リリース
- 関連ページ