|
|
matplotlib mplot3d_Examples 13_offset_demo. |
H.Kamifuji . |
- offset_demo.py
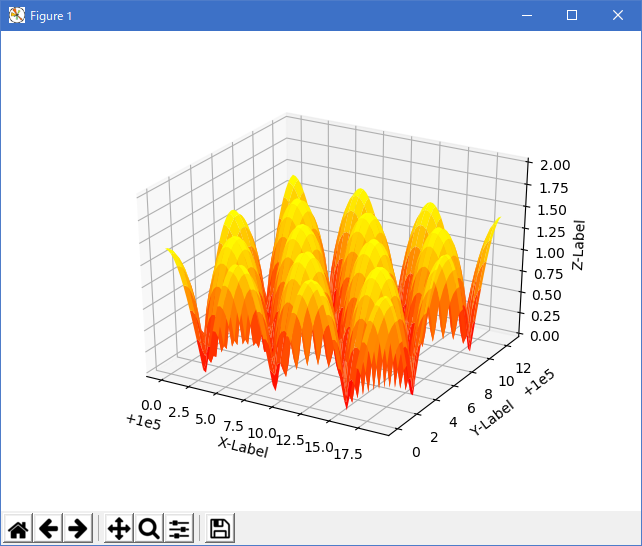
from mpl_toolkits.mplot3d import Axes3D
import matplotlib.pyplot as plt
import numpy as np

# This example demonstrates mplot3d's offset text display.
# As one rotates the 3D figure, the offsets should remain oriented
# same way as the axis label, and should also be located "away"
# from the center of the plot.
#
# This demo triggers the display of the offset text for the x and
# y axis by adding 1e5 to X and Y. Anything less would not
# automatically trigger it.

fig = plt.figure()
ax = fig.gca(projection='3d')
X, Y = np.mgrid[0:6*np.pi:0.25, 0:4*np.pi:0.25]
Z = np.sqrt(np.abs(np.cos(X) + np.cos(Y)))

surf = ax.plot_surface(X + 1e5, Y + 1e5, Z, cmap='autumn', cstride=2, rstride=2)
ax.set_xlabel("X-Label")
ax.set_ylabel("Y-Label")
ax.set_zlabel("Z-Label")
ax.set_zlim(0, 2)

plt.show()
- 実行結果( offset_demo.png )
Python 3.11.2 見直しました。上記のコードでは、下記のエラーが発生します。
Traceback (most recent call last):
File "_:\offset_demo.py", line 15, in <module>
ax = fig.gca(projection='3d')
^^^^^^^^^^^^^^^^^^^^^^^^
TypeError: FigureBase.gca() got an unexpected keyword argument 'projection'
matplotlib 内部のエラーのようです。matplotlib の改修(先祖帰りバグの改修)を待つしかない。
Python 3.11.6 (matplotlib 3.7.1) では、下記のようなエラーがあり、実行できない。
Traceback (most recent call last): File "M:\______\offset_demo.py", line 15, in
Python 3.12.0 (matplotlib 3.8.1) では、下記のようなエラーがあり、実行できない。ax = fig.gca(projection='3d') ^^^^^^^^^^^^^^^^^^^^^^^^ TypeError: FigureBase.gca() got an unexpected keyword argument 'projection'
Traceback (most recent call last): File "E:\______\offset_demo.py", line 15, in
Python 3.11.6 (matplotlib 3.7.1) 及び Python 3.12.0 (matplotlib 3.8.1) で、見直し中、新しいサンプル(mplot3d-offset-py) を見つけ、下記のコードで、正常に実行できました。ax = fig.gca(projection='3d') ^^^^^^^^^^^^^^^^^^^^^^^^ TypeError: FigureBase.gca() got an unexpected keyword argument 'projection'
"""
=========================
Automatic text offsetting
=========================

This example demonstrates mplot3d's offset text display.
As one rotates the 3D figure, the offsets should remain oriented the
same way as the axis label, and should also be located "away"
from the center of the plot.

This demo triggers the display of the offset text for the x- and
y-axis by adding 1e5 to X and Y. Anything less would not
automatically trigger it.
"""

import matplotlib.pyplot as plt
import numpy as np

ax = plt.figure().add_subplot(projection='3d')

X, Y = np.mgrid[0:6*np.pi:0.25, 0:4*np.pi:0.25]
Z = np.sqrt(np.abs(np.cos(X) + np.cos(Y)))

ax.plot_surface(X + 1e5, Y + 1e5, Z, cmap='autumn', cstride=2, rstride=2)

ax.set_xlabel("X label")
ax.set_ylabel("Y label")
ax.set_zlabel("Z label")
ax.set_zlim(0, 2)

plt.show()
Python 3.11.6 (matplotlib 3.7.1) 及び Python 3.12.0 (matplotlib 3.8.1) 共に、正常実行です。

- 参照ページ
mplot3d_Examples code: offset_demo.py
mplot3d-offset-py
- リリースノート
- 2023/11/19 Ver=1.04 Python 3.12.0 (matplotlib 3.8.1)で確認
- 2023/11/19 Ver=1.04 Python 3.11.6 (matplotlib 3.7.1)で確認
- 2023/03/31 Ver=1.03 Python 3.11.2 で確認
- 2020/10/30 Ver=1.01 Python 3.7.8 で確認
- 2018/11/28 Ver=1.01 初版リリース
- 関連ページ