|
|
matplotlib mplot3d_Examples 11_lorenz_attractor. |
H.Kamifuji . |
- lorenz_attractor.py
注:これはシンプルな非線形の ODE であるため、SciPy の ode ソルバーを使用する方が簡単ですが、このアプローチは NumPy のみに依存します。
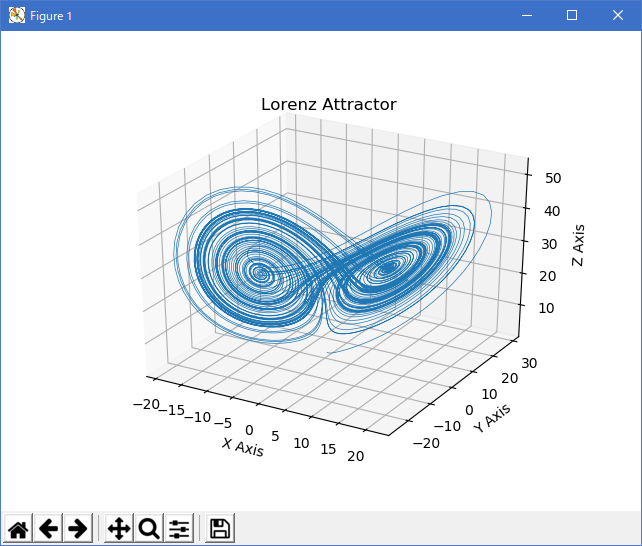
# Plot of the Lorenz Attractor based on Edward Lorenz's 1963 "Deterministic
# Nonperiodic Flow" publication.
# http://journals.ametsoc.org/doi/abs/10.1175/
#                           1520-0469%281963%29020%3C0130%3ADNF%3E2.0.CO%3B2
#
# Note: Because this is a simple non-linear ODE, it would be more easily
#       done using SciPy's ode solver, but this approach depends only
#       upon NumPy.

import numpy as np
import matplotlib.pyplot as plt
from mpl_toolkits.mplot3d import Axes3D


def lorenz(x, y, z, s=10, r=28, b=2.667):
    x_dot = s*(y - x)
    y_dot = r*x - y - x*z
    z_dot = x*y - b*z
    return x_dot, y_dot, z_dot


dt = 0.01
stepCnt = 10000

# Need one more for the initial values
xs = np.empty((stepCnt + 1,))
ys = np.empty((stepCnt + 1,))
zs = np.empty((stepCnt + 1,))

# Setting initial values
xs[0], ys[0], zs[0] = (0., 1., 1.05)

# Stepping through "time".
for i in range(stepCnt):
    # Derivatives of the X, Y, Z state
    x_dot, y_dot, z_dot = lorenz(xs[i], ys[i], zs[i])
    xs[i + 1] = xs[i] + (x_dot * dt)
    ys[i + 1] = ys[i] + (y_dot * dt)
    zs[i + 1] = zs[i] + (z_dot * dt)

fig = plt.figure()
ax = fig.gca(projection='3d')

ax.plot(xs, ys, zs, lw=0.5)
ax.set_xlabel("X Axis")
ax.set_ylabel("Y Axis")
ax.set_zlabel("Z Axis")
ax.set_title("Lorenz Attractor")

plt.show()
- 実行結果( lorenz_attractor.png )
Python 3.11.2 見直しました。上記のコードでは、下記のエラーが発生します。
Traceback (most recent call last):
File "_:\lorenz_attractor.py", line 41, in <module>
ax = fig.gca(projection='3d')
^^^^^^^^^^^^^^^^^^^^^^^^
TypeError: FigureBase.gca() got an unexpected keyword argument 'projection'
matplotlib 内部のエラーのようです。matplotlib の改修(先祖帰りバグの改修)を待つしかない。
Python 3.11.6 (matplotlib 3.7.1) では、下記のようなエラーがあり、実行できない。
Traceback (most recent call last): File "M:\______\lorenz_attractor.py", line 41, in
Python 3.12.0 (matplotlib 3.8.1) では、下記のようなエラーがあり、実行できない。ax = fig.gca(projection='3d') ^^^^^^^^^^^^^^^^^^^^^^^^ TypeError: FigureBase.gca() got an unexpected keyword argument 'projection'
Traceback (most recent call last): File "E:\______\lorenz_attractor.py", line 41, in
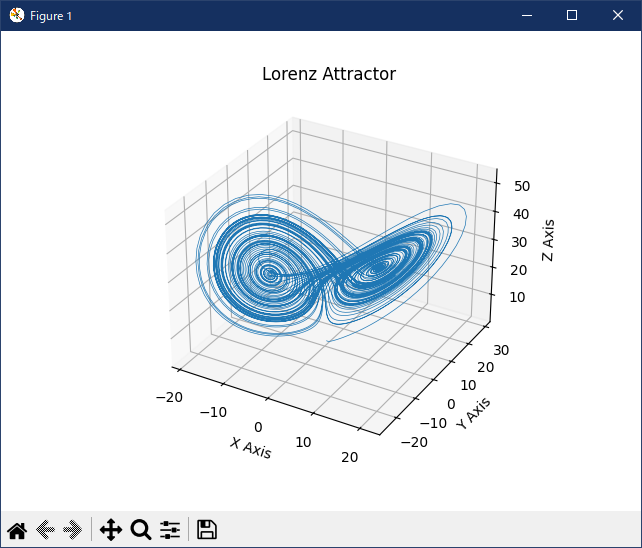
Python 3.11.6 (matplotlib 3.7.1) 及び Python 3.12.0 (matplotlib 3.8.1) で、見直し中、新しいサンプル( mplot3d-lorenz-attractor-py ) を見つけ、下記のコードで、正常に実行できました。ax = fig.gca(projection='3d') ^^^^^^^^^^^^^^^^^^^^^^^^ TypeError: FigureBase.gca() got an unexpected keyword argument 'projection'
"""
================
Lorenz attractor
================

This is an example of plotting Edward Lorenz's 1963 `"Deterministic Nonperiodic
Flow"`_ in a 3-dimensional space using mplot3d.

.. _"Deterministic Nonperiodic Flow":
   https://journals.ametsoc.org/view/journals/atsc/20/2/1520-0469_1963_020_0130_dnf_2_0_co_2.xml

.. note::
   Because this is a simple non-linear ODE, it would be more easily done using
   SciPy's ODE solver, but this approach depends only upon NumPy.
"""

import matplotlib.pyplot as plt
import numpy as np


def lorenz(xyz, *, s=10, r=28, b=2.667):
    """
    Parameters
    ----------
    xyz : array-like, shape (3,)
       Point of interest in three-dimensional space.
    s, r, b : float
       Parameters defining the Lorenz attractor.

    Returns
    -------
    xyz_dot : array, shape (3,)
       Values of the Lorenz attractor's partial derivatives at *xyz*.
    """
    x, y, z = xyz
    x_dot = s*(y - x)
    y_dot = r*x - y - x*z
    z_dot = x*y - b*z
    return np.array([x_dot, y_dot, z_dot])


dt = 0.01
num_steps = 10000

xyzs = np.empty((num_steps + 1, 3))  # Need one more for the initial values
xyzs[0] = (0., 1., 1.05)  # Set initial values
# Step through "time", calculating the partial derivatives at the current point
# and using them to estimate the next point
for i in range(num_steps):
    xyzs[i + 1] = xyzs[i] + lorenz(xyzs[i]) * dt

# Plot
ax = plt.figure().add_subplot(projection='3d')

ax.plot(*xyzs.T, lw=0.5)
ax.set_xlabel("X Axis")
ax.set_ylabel("Y Axis")
ax.set_zlabel("Z Axis")
ax.set_title("Lorenz Attractor")

plt.show()
Python 3.11.6 (matplotlib 3.7.1) 及び Python 3.12.0 (matplotlib 3.8.1) 共に、正常実行です。
- 参照ページ
mplot3d_Examples code: lorenz_attractor.py
mplot3d-lorenz-attractor-py
- リリースノート
- 2023/11/19 Ver=1.04 Python 3.12.0 (matplotlib 3.8.1)で確認
- 2023/11/19 Ver=1.04 Python 3.11.6 (matplotlib 3.7.1)で確認
- 2023/03/31 Ver=1.03 Python 3.11.2 で確認
- 2020/10/30 Ver=1.01 Python 3.7.8 で確認
- 2018/11/28 Ver=1.01 初版リリース
- 関連ページ