|
|
matplotlib mplot3d_Examples 06_contourf3d_demo. |
H.Kamifuji . |
- contourf3d_demo.py
from mpl_toolkits.mplot3d import axes3d
import matplotlib.pyplot as plt
from matplotlib import cm

fig = plt.figure()
ax = fig.gca(projection='3d')
X, Y, Z = axes3d.get_test_data(0.05)
cset = ax.contourf(X, Y, Z, cmap=cm.coolwarm)
ax.clabel(cset, fontsize=9, inline=1)

plt.show()
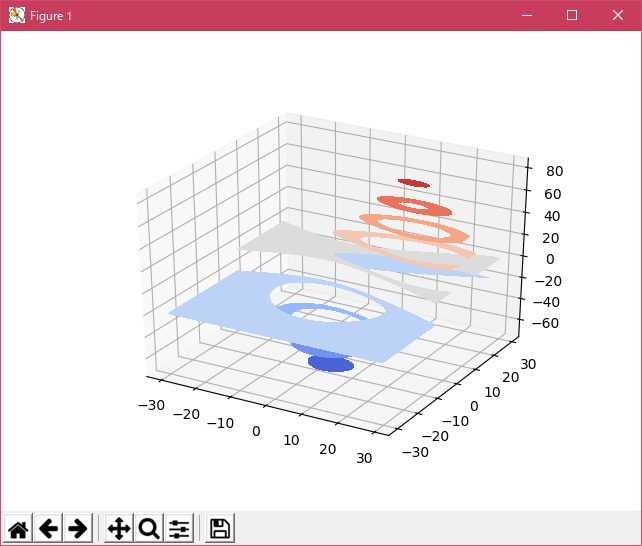
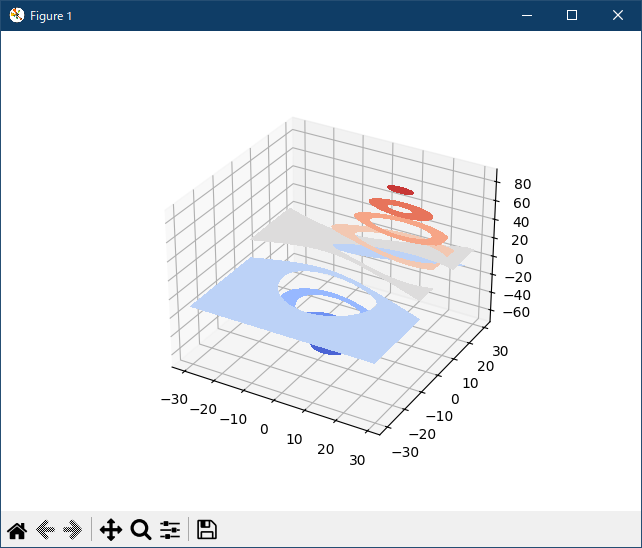
- 実行結果( contourf3d_demo.png )
Python 3.11.2 見直しました。上記のコードでは、下記のエラーが発生します。
Traceback (most recent call last):
File "_:\contourf3d_demo.py", line 6, in <module>
ax = fig.gca(projection='3d')
^^^^^^^^^^^^^^^^^^^^^^^^
TypeError: FigureBase.gca() got an unexpected keyword argument 'projection'
matplotlib 内部のエラーのようです。matplotlib の改修(先祖帰りバグの改修)を待つしかない。
Python 3.11.6 (matplotlib 3.7.1) では、下記のようなエラーがあり、実行できない。
Traceback (most recent call last): File "M:\______\contourf3d_demo.py", line 6, in
Python 3.12.0 (matplotlib 3.8.1) では、下記のようなエラーがあり、実行できない。ax = fig.gca(projection='3d') ^^^^^^^^^^^^^^^^^^^^^^^^ TypeError: FigureBase.gca() got an unexpected keyword argument 'projection'
Traceback (most recent call last): File "E:\______\contourf3d_demo.py", line 6, in
Python 3.11.6 (matplotlib 3.7.1) 及び Python 3.12.0 (matplotlib 3.8.1) で、見直し中、新しいサンプル( mplot3d-contourf3d-py ) を見つけ、下記のコードで、正常に実行できました。ax = fig.gca(projection='3d') ^^^^^^^^^^^^^^^^^^^^^^^^ TypeError: FigureBase.gca() got an unexpected keyword argument 'projection'
"""
===============
Filled contours
===============

`.Axes3D.contourf` differs from `.Axes3D.contour` in that it creates filled
contours, i.e. a discrete number of colours are used to shade the domain.

This is like a `.Axes.contourf` plot in 2D except that the shaded region
corresponding to the level c is graphed on the plane ``z=c``.
"""

import matplotlib.pyplot as plt

from matplotlib import cm
from mpl_toolkits.mplot3d import axes3d

ax = plt.figure().add_subplot(projection='3d')
X, Y, Z = axes3d.get_test_data(0.05)
ax.contourf(X, Y, Z, cmap=cm.coolwarm)

plt.show()
Python 3.11.6 (matplotlib 3.7.1) 及び Python 3.12.0 (matplotlib 3.8.1) 共に、正常実行です。
- 参照ページ
mplot3d_Examples code: contourf3d_demo.py
mplot3d-contourf3d-py
- リリースノート
- 2023/11/19 Ver=1.04 Python 3.12.0 (matplotlib 3.8.1)で確認
- 2023/11/19 Ver=1.04 Python 3.11.6 (matplotlib 3.7.1)で確認
- 2023/03/31 Ver=1.03 Python 3.11.2 で確認
- 2020/10/30 Ver=1.01 Python 3.7.8 で確認
- 2018/11/28 Ver=1.01 初版リリース
- 関連ページ