|
|
matplotlib mplot3d_Examples 05_contour3d_demo3. |
H.Kamifuji . |
- contour3d_demo3.py
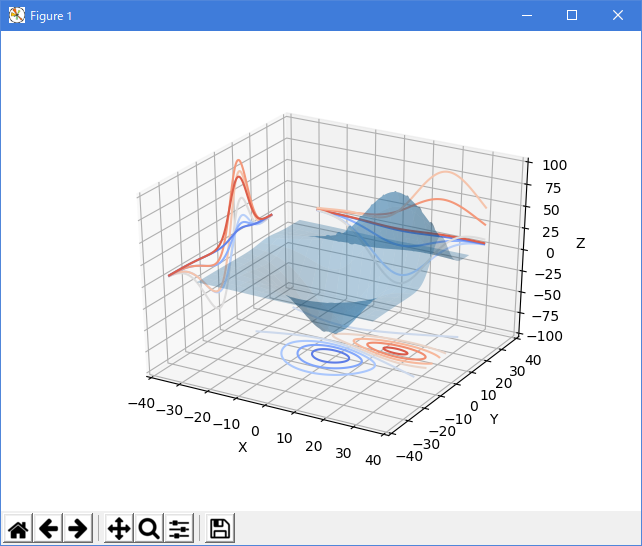
from mpl_toolkits.mplot3d import axes3d
import matplotlib.pyplot as plt
from matplotlib import cm

fig = plt.figure()
ax = fig.gca(projection='3d')
X, Y, Z = axes3d.get_test_data(0.05)
ax.plot_surface(X, Y, Z, rstride=8, cstride=8, alpha=0.3)
cset = ax.contour(X, Y, Z, zdir='z', offset=-100, cmap=cm.coolwarm)
cset = ax.contour(X, Y, Z, zdir='x', offset=-40, cmap=cm.coolwarm)
cset = ax.contour(X, Y, Z, zdir='y', offset=40, cmap=cm.coolwarm)

ax.set_xlabel('X')
ax.set_xlim(-40, 40)
ax.set_ylabel('Y')
ax.set_ylim(-40, 40)
ax.set_zlabel('Z')
ax.set_zlim(-100, 100)

plt.show()
- 実行結果( contour3d_demo3.png )
Python 3.11.2 見直しました。上記のコードでは、下記のエラーが発生します。
Traceback (most recent call last):
File "_:\contour3d_demo3.py", line 6, in <module>
ax = fig.gca(projection='3d')
^^^^^^^^^^^^^^^^^^^^^^^^
TypeError: FigureBase.gca() got an unexpected keyword argument 'projection'
matplotlib 内部のエラーのようです。matplotlib の改修(先祖帰りバグの改修)を待つしかない。
Python 3.11.6 (matplotlib 3.7.1) では、下記のようなエラーがあり、実行できない。
Traceback (most recent call last): File "M:\______\contour3d_demo3.py", line 6, in
Python 3.12.0 (matplotlib 3.8.1) では、下記のようなエラーがあり、実行できない。ax = fig.gca(projection='3d') ^^^^^^^^^^^^^^^^^^^^^^^^ TypeError: FigureBase.gca() got an unexpected keyword argument 'projection'
Traceback (most recent call last): File "E:\______\contour3d_demo3.py", line 6, in
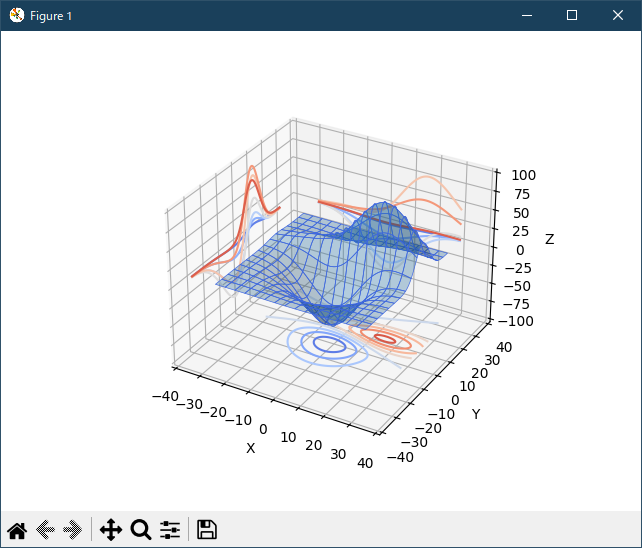
Python 3.11.6 (matplotlib 3.7.1) 及び Python 3.12.0 (matplotlib 3.8.1) で、見直し中、新しいサンプル( mplot3d-contour3d-3-py ) を見つけ、下記のコードで、正常に実行できました。ax = fig.gca(projection='3d') ^^^^^^^^^^^^^^^^^^^^^^^^ TypeError: FigureBase.gca() got an unexpected keyword argument 'projection'
"""
=====================================
Project contour profiles onto a graph
=====================================
Demonstrates displaying a 3D surface while also projecting contour 'profiles'
onto the 'walls' of the graph.
See :doc:`contourf3d_2` for the filled version.
"""

import matplotlib.pyplot as plt

from mpl_toolkits.mplot3d import axes3d

ax = plt.figure().add_subplot(projection='3d')
X, Y, Z = axes3d.get_test_data(0.05)

# Plot the 3D surface
ax.plot_surface(X, Y, Z, edgecolor='royalblue', lw=0.5, rstride=8, cstride=8,
                alpha=0.3)

# Plot projections of the contours for each dimension.  By choosing offsets
# that match the appropriate axes limits, the projected contours will sit on
# the 'walls' of the graph.
ax.contour(X, Y, Z, zdir='z', offset=-100, cmap='coolwarm')
ax.contour(X, Y, Z, zdir='x', offset=-40, cmap='coolwarm')
ax.contour(X, Y, Z, zdir='y', offset=40, cmap='coolwarm')

ax.set(xlim=(-40, 40), ylim=(-40, 40), zlim=(-100, 100),
       xlabel='X', ylabel='Y', zlabel='Z')

plt.show()
Python 3.11.6 (matplotlib 3.7.1) 及び Python 3.12.0 (matplotlib 3.8.1) 共に、正常実行です。
- 参照ページ
mplot3d_Examples code: contour3d_demo3.py
mplot3d-contour3d-3-py
- リリースノート
- 2023/11/19 Ver=1.04 Python 3.12.0 (matplotlib 3.8.1)で確認
- 2023/11/19 Ver=1.04 Python 3.11.6 (matplotlib 3.7.1)で確認
- 2023/03/31 Ver=1.03 Python 3.11.2 で確認
- 2020/10/30 Ver=1.01 Python 3.7.8 で確認
- 2018/11/28 Ver=1.01 初版リリース
- 関連ページ