|
|
matplotlib mplot3d_Examples 04_contour3d_demo2. |
H.Kamifuji . |
- contour3d_demo2.py
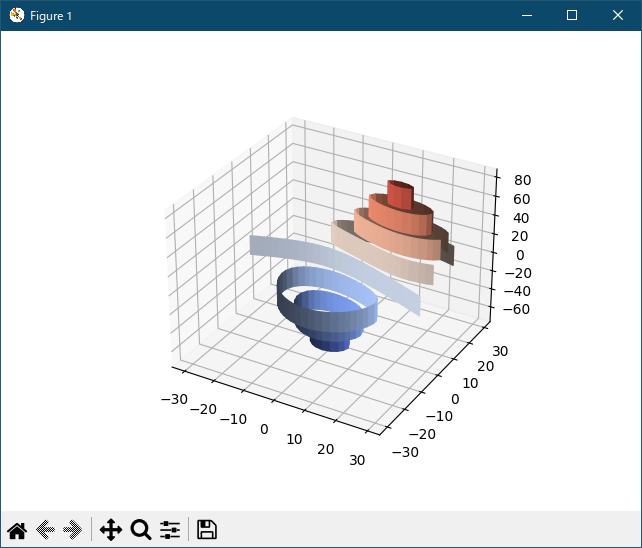
from mpl_toolkits.mplot3d import axes3d
import matplotlib.pyplot as plt
from matplotlib import cm

fig = plt.figure()
ax = fig.gca(projection='3d')
X, Y, Z = axes3d.get_test_data(0.05)
cset = ax.contour(X, Y, Z, extend3d=True, cmap=cm.coolwarm)
ax.clabel(cset, fontsize=9, inline=1)

plt.show()
- 実行結果( contour3d_demo2.png )

Python 3.11.2 見直しました。上記のコードでは、下記のエラーが発生します。
Traceback (most recent call last):
File "_:\contour3d_demo2.py", line 6, in <module>
ax = fig.gca(projection='3d')
^^^^^^^^^^^^^^^^^^^^^^^^
TypeError: FigureBase.gca() got an unexpected keyword argument 'projection'
matplotlib 内部のエラーのようです。matplotlib の改修(先祖帰りバグの改修)を待つしかない。
Python 3.11.6 (matplotlib 3.7.1) では、下記のようなエラーがあり、実行できない。
Traceback (most recent call last): File "M:\______\contour3d_demo2.py", line 6, in
Python 3.12.0 (matplotlib 3.8.1) では、下記のようなエラーがあり、実行できない。ax = fig.gca(projection='3d') ^^^^^^^^^^^^^^^^^^^^^^^^ TypeError: FigureBase.gca() got an unexpected keyword argument 'projection'
Traceback (most recent call last): File "E:\______\contour3d_demo2.py", line 6, in
Python 3.11.6 (matplotlib 3.7.1) 及び Python 3.12.0 (matplotlib 3.8.1) で、見直し中、新しいサンプル( mplot3d-contour3d-2-py ) を見つけ、下記のコードで、正常に実行できました。ax = fig.gca(projection='3d') ^^^^^^^^^^^^^^^^^^^^^^^^ TypeError: FigureBase.gca() got an unexpected keyword argument 'projection'
"""
===========================================================
Plot contour (level) curves in 3D using the extend3d option
===========================================================

This modification of the :doc:`contour3d` example uses ``extend3d=True`` to
extend the curves vertically into 'ribbons'.
"""

import matplotlib.pyplot as plt

from matplotlib import cm
from mpl_toolkits.mplot3d import axes3d

ax = plt.figure().add_subplot(projection='3d')
X, Y, Z = axes3d.get_test_data(0.05)
ax.contour(X, Y, Z, extend3d=True, cmap=cm.coolwarm)

plt.show()
Python 3.11.6 (matplotlib 3.7.1) 及び Python 3.12.0 (matplotlib 3.8.1) 共に、正常実行です。
- 参照ページ
mplot3d_Examples code: contour3d_demo2.py
mplot3d-contour3d-2-py
- リリースノート
- 2023/11/19 Ver=1.04 Python 3.12.0 (matplotlib 3.8.1)で確認
- 2023/11/19 Ver=1.04 Python 3.11.6 (matplotlib 3.7.1)で確認
- 2023/03/31 Ver=1.03 Python 3.11.2 で確認
- 2020/10/30 Ver=1.01 Python 3.7.8 で確認
- 2018/11/28 Ver=1.01 初版リリース
- 関連ページ