|
|
matplotlib mplot3d_Examples 01_2dcollections3d_demo. |
H.Kamifuji . |
- 2dcollections3d_demo.py
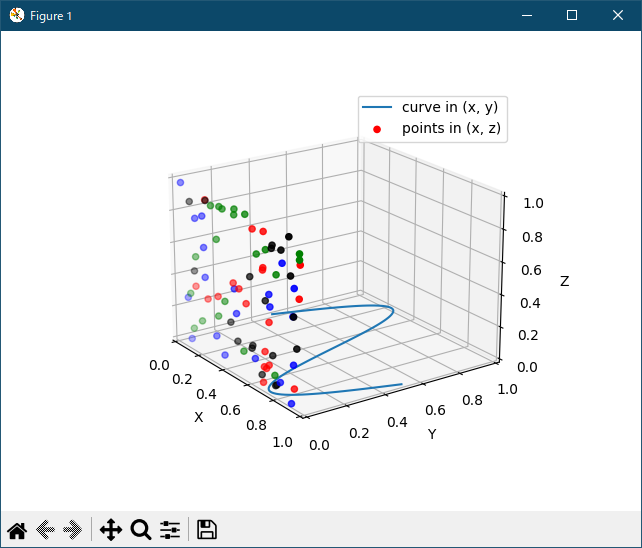
ax.plot の zdir キーワードを使用して、3D プロットの選択軸に2Dデータをプロットする方法を示します。
"""
=======================
Plot 2D data on 3D plot
=======================

Demonstrates using ax.plot's zdir keyword to plot 2D data on
selective axes of a 3D plot.
"""

from mpl_toolkits.mplot3d import Axes3D
import numpy as np
import matplotlib.pyplot as plt

fig = plt.figure()
ax = fig.gca(projection='3d')

# Plot a sin curve using the x and y axes.
x = np.linspace(0, 1, 100)
y = np.sin(x * 2 * np.pi) / 2 + 0.5
ax.plot(x, y, zs=0, zdir='z', label='curve in (x,y)')

# Plot scatterplot data (20 2D points per colour) on the x and z axes.
colors = ('r', 'g', 'b', 'k')
x = np.random.sample(20*len(colors))
y = np.random.sample(20*len(colors))
c_list = []
for c in colors:
    c_list.append([c]*20)
# By using zdir='y', the y value of these points is fixed to the zs value 0
# and the (x,y) points are plotted on the x and z axes.
ax.scatter(x, y, zs=0, zdir='y', c=c_list, label='points in (x,z)')

# Make legend, set axes limits and labels
ax.legend()
ax.set_xlim(0, 1)
ax.set_ylim(0, 1)
ax.set_zlim(0, 1)
ax.set_xlabel('X')
ax.set_ylabel('Y')
ax.set_zlabel('Z')

# Customize the view angle so it's easier to see that the scatter points lie
# on the plane y=0
ax.view_init(elev=20., azim=-35)

plt.show()
- 実行結果( 2dcollections3d_demo_ux.log )
当方の環境では、動作しない。出力 msg は、下記
$ py 2dcollections3d_demo.py Traceback (most recent call last): File "/opt/rh/rh-python36/root/usr/lib64/python3.6/site-packages/matplotlib/colors.py", line 158, in to_rgba rgba = _colors_full_map.cache[c, alpha] TypeError: unhashable type: 'list' During handling of the above exception, another exception occurred: Traceback (most recent call last): File "/opt/rh/rh-python36/root/usr/lib64/python3.6/site-packages/matplotlib/axes/_axes.py", line 4210, in scatter colors = mcolors.to_rgba_array(c) File "/opt/rh/rh-python36/root/usr/lib64/python3.6/site-packages/matplotlib/colors.py", line 259, in to_rgba_array result[i] = to_rgba(cc, alpha) File "/opt/rh/rh-python36/root/usr/lib64/python3.6/site-packages/matplotlib/colors.py", line 160, in to_rgba rgba = _to_rgba_no_colorcycle(c, alpha) File "/opt/rh/rh-python36/root/usr/lib64/python3.6/site-packages/matplotlib/colors.py", line 211, in _to_rgba_no_colorcycle raise ValueError("Invalid RGBA argument: {!r}".format(orig_c)) ValueError: Invalid RGBA argument: ['r', 'r', 'r', 'r', 'r', 'r', 'r', 'r', 'r', 'r', 'r', 'r', 'r', 'r', 'r', 'r', 'r', 'r', 'r', 'r'] During handling of the above exception, another exception occurred: Traceback (most recent call last): File "2dcollections3d_demo.py", line 31, inPython 3.11.2 見直しました。上記のコードでは、下記のエラーが発生します。ax.scatter(x, y, zs=0, zdir='y', c=c_list, label='points in (x,z)') File "/opt/rh/rh-python36/root/usr/lib64/python3.6/site-packages/mpl_toolkits/mplot3d/axes3d.py", line 2294, in scatter patches = super().scatter(xs, ys, s=s, c=c, *args, **kwargs) File "/opt/rh/rh-python36/root/usr/lib64/python3.6/site-packages/matplotlib/__init__.py", line 1785, in inner return func(ax, *args, **kwargs) File "/opt/rh/rh-python36/root/usr/lib64/python3.6/site-packages/matplotlib/axes/_axes.py", line 4231, in scatter .format(c) ValueError: 'c' argument must either be valid as mpl color(s) or as numbers to be mapped to colors. Here c = [['r', 'r', 'r', 'r', 'r', 'r', 'r', 'r', 'r', 'r', 'r', 'r', 'r', 'r', 'r', 'r', 'r', 'r', 'r', 'r'], ['g', 'g', 'g', 'g', 'g', 'g', 'g', 'g', 'g', 'g', 'g', 'g', 'g', 'g', 'g', 'g', 'g', 'g', 'g', 'g'], ['b', 'b', 'b', 'b', 'b', 'b', 'b', 'b', 'b', 'b', 'b', 'b', 'b', 'b', 'b', 'b', 'b', 'b', 'b', 'b'], ['k', 'k', 'k', 'k', 'k', 'k', 'k', 'k', 'k', 'k', 'k', 'k', 'k', 'k', 'k', 'k', 'k', 'k', 'k', 'k']].
Traceback (most recent call last):
File "_:\2dcollections3d_demo.py", line 15, in <module>
ax = fig.gca(projection='3d')
^^^^^^^^^^^^^^^^^^^^^^^^
TypeError: FigureBase.gca() got an unexpected keyword argument 'projection'
matplotlib 内部のエラーのようです。matplotlib の改修(先祖帰りバグの改修)を待つしかない。
Python 3.11.6 (matplotlib 3.7.1) では、下記のようなエラーがあり、実行できない。
Traceback (most recent call last): File "M:\______\2dcollections3d_demo.py", line 15, in
Python 3.12.0 (matplotlib 3.8.1) では、下記のようなエラーがあり、実行できない。ax = fig.gca(projection='3d') ^^^^^^^^^^^^^^^^^^^^^^^^ TypeError: FigureBase.gca() got an unexpected keyword argument 'projection'
Traceback (most recent call last): File "E:\______\2dcollections3d_demo.py", line 15, in
Python 3.11.6 (matplotlib 3.7.1) 及び Python 3.12.0 (matplotlib 3.8.1) で、見直し中、新しいサンプル(mplot3d-2dcollections3d-py) を見つけ、下記のコードで、正常に実行できました。ax = fig.gca(projection='3d') ^^^^^^^^^^^^^^^^^^^^^^^^ TypeError: FigureBase.gca() got an unexpected keyword argument 'projection'
"""
=======================
Plot 2D data on 3D plot
=======================

Demonstrates using ax.plot's *zdir* keyword to plot 2D data on
selective axes of a 3D plot.
"""

import matplotlib.pyplot as plt
import numpy as np

ax = plt.figure().add_subplot(projection='3d')

# Plot a sin curve using the x and y axes.
x = np.linspace(0, 1, 100)
y = np.sin(x * 2 * np.pi) / 2 + 0.5
ax.plot(x, y, zs=0, zdir='z', label='curve in (x, y)')

# Plot scatterplot data (20 2D points per colour) on the x and z axes.
colors = ('r', 'g', 'b', 'k')

# Fixing random state for reproducibility
np.random.seed(19680801)

x = np.random.sample(20 * len(colors))
y = np.random.sample(20 * len(colors))
c_list = []
for c in colors:
    c_list.extend([c] * 20)
# By using zdir='y', the y value of these points is fixed to the zs value 0
# and the (x, y) points are plotted on the x and z axes.
ax.scatter(x, y, zs=0, zdir='y', c=c_list, label='points in (x, z)')

# Make legend, set axes limits and labels
ax.legend()
ax.set_xlim(0, 1)
ax.set_ylim(0, 1)
ax.set_zlim(0, 1)
ax.set_xlabel('X')
ax.set_ylabel('Y')
ax.set_zlabel('Z')

# Customize the view angle so it's easier to see that the scatter points lie
# on the plane y=0
ax.view_init(elev=20., azim=-35, roll=0)

plt.show()
Python 3.11.6 (matplotlib 3.7.1) 及び Python 3.12.0 (matplotlib 3.8.1) 共に、正常実行です。
- 参照ページ
mplot3d_Examples code: 2dcollections3d_demo.py
mplot3d-2dcollections3d-py
- リリースノート
- 2023/11/19 Ver=1.04 Python 3.12.0 (matplotlib 3.8.1)で確認
- 2023/11/19 Ver=1.04 Python 3.11.6 (matplotlib 3.7.1)で確認
- 2023/03/31 Ver=1.03 Python 3.11.2 で確認
- 2020/10/30 Ver=1.01 Python 3.7.8 で確認
- 2018/11/28 Ver=1.01 初版リリース
- 関連ページ