|
|
lines_bars_and_markers_Examples 02_fill_demo. |
H.Kamifuji . |
- fill_demo.py
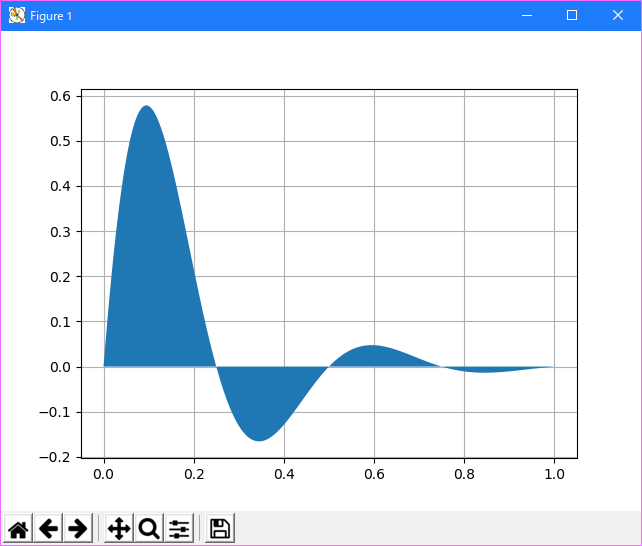
この例では、ユーザが matplotlib を使ってできる最も基本的な塗りつぶしプロットを示しています。
"""
==================
A simple Fill plot
==================

This example showcases the most basic fill plot a user can do with matplotlib.
"""
import numpy as np
import matplotlib.pyplot as plt

x = np.linspace(0, 1, 500)
y = np.sin(4 * np.pi * x) * np.exp(-5 * x)

fig, ax = plt.subplots()

ax.fill(x, y, zorder=10)
ax.grid(True, zorder=5)
plt.show()
- 実行結果( fill_demo.png )
- 参照ページ
lines_bars_and_markers_Examples code: fill_demo.py
- リリースノート
- 2023/03/30 Ver=1.03 Python 3.11.2 で確認
- 2020/10/30 Ver=1.01 Python 3.7.8 で確認
- 2018/11/25 Ver=1.01 初版リリース
- 関連ページ