|
|
event_handling_Examples 20_zoom_window. |
H.Kamifuji . |
- zoom_window.py
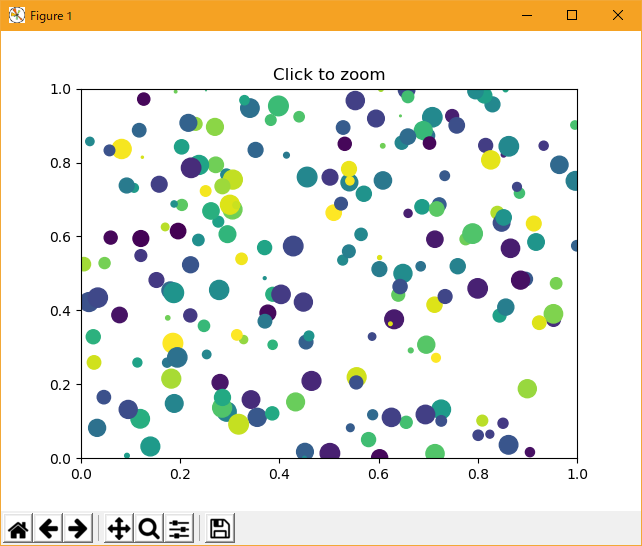
この例では、マウスを押すなど、1 つのウィンドウ内のイベントを別の Figure ウィンドウに接続する方法を示します。
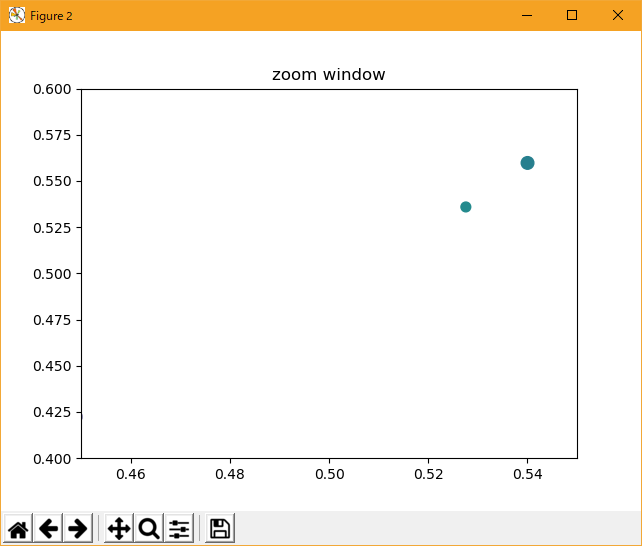
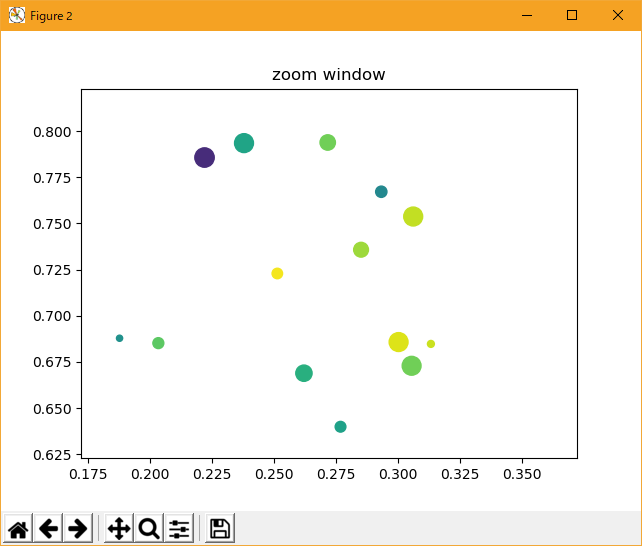
最初のウィンドウでポイントをクリックすると、2 番目のウィンドウのズームの中心がクリックされたポイントの x、y 座標になるように、2 番目の z と y の制限が調整されます。
散布図の円の直径は point**2 で定義されているため、そのサイズはズームとは関係ありません
"""
This example shows how to connect events in one window, for example, a mouse
press, to another figure window.

If you click on a point in the first window, the z and y limits of the
second will be adjusted so that the center of the zoom in the second
window will be the x,y coordinates of the clicked point.

Note the diameter of the circles in the scatter are defined in
points**2, so their size is independent of the zoom
"""
from matplotlib.pyplot import figure, show
import numpy
figsrc = figure()
figzoom = figure()

axsrc = figsrc.add_subplot(111, xlim=(0, 1), ylim=(0, 1), autoscale_on=False)
axzoom = figzoom.add_subplot(111, xlim=(0.45, 0.55), ylim=(0.4, .6),
                             autoscale_on=False)
axsrc.set_title('Click to zoom')
axzoom.set_title('zoom window')
x, y, s, c = numpy.random.rand(4, 200)
s *= 200


axsrc.scatter(x, y, s, c)
axzoom.scatter(x, y, s, c)


def onpress(event):
    if event.button != 1:
        return
    x, y = event.xdata, event.ydata
    axzoom.set_xlim(x - 0.1, x + 0.1)
    axzoom.set_ylim(y - 0.1, y + 0.1)
    figzoom.canvas.draw()

figsrc.canvas.mpl_connect('button_press_event', onpress)
show()
- 実行結果( zoom_window.png )
- 参照ページ
event_handling_Examples code: zoom_window.py
- リリースノート
- 2023/03/29 Ver=1.03 Python 3.11.2 で確認
- 2020/10/30 Ver=1.01 Python 3.7.8 で確認
- 2018/11/25 Ver=1.01 初版リリース
- 関連ページ