|
|
event_handling_Examples 19_viewlims. |
H.Kamifuji . |
- viewlims.py
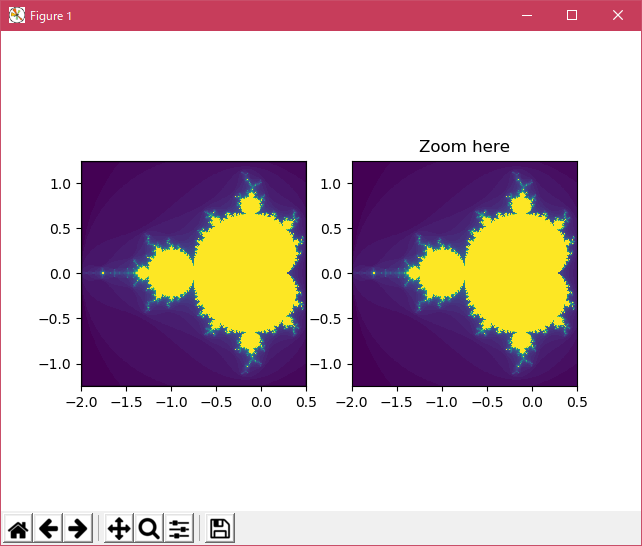
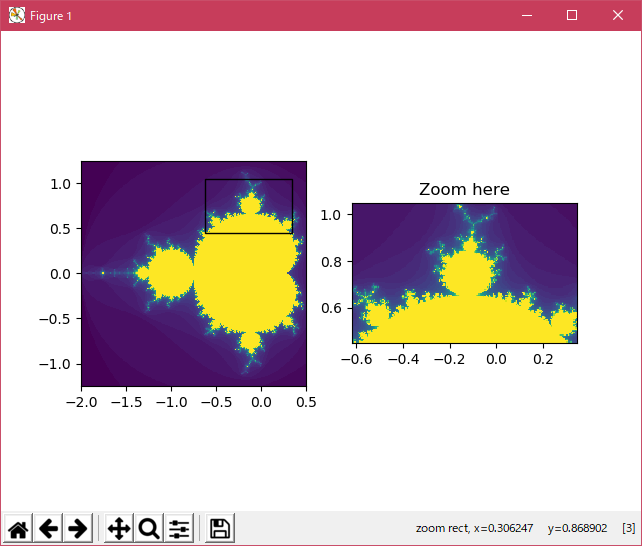
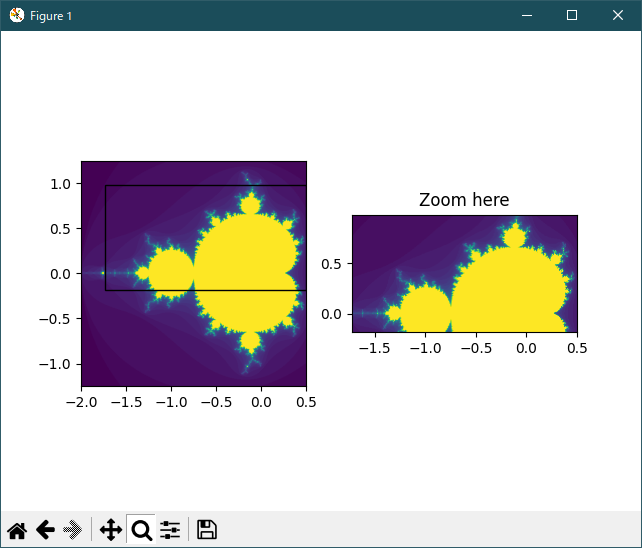
2 つの同一のパネルを作成します。 右側のパネルをズームインすると、最初のパネルにズームした領域を示す四角形が表示されます。
Axes インスタンスで呼び出すことができるように Rectangle をサブクラス化するだけで、長方形が Axes の境界に一致するようにその形状を更新します
あなたが拡大するにつれてフラクタルセットを再生成するクラスで、実際にその詳細を見ることができます。 左側のパネルのボックスには、ズームした領域が表示されます。
# Creates two identical panels.  Zooming in on the right panel will show
# a rectangle in the first panel, denoting the zoomed region.
import numpy as np
import matplotlib.pyplot as plt
from matplotlib.patches import Rectangle


# We just subclass Rectangle so that it can be called with an Axes
# instance, causing the rectangle to update its shape to match the
# bounds of the Axes
class UpdatingRect(Rectangle):
    def __call__(self, ax):
        self.set_bounds(*ax.viewLim.bounds)
        ax.figure.canvas.draw_idle()


# A class that will regenerate a fractal set as we zoom in, so that you
# can actually see the increasing detail.  A box in the left panel will show
# the area to which we are zoomed.
class MandelbrotDisplay(object):
    def __init__(self, h=500, w=500, niter=50, radius=2., power=2):
        self.height = h
        self.width = w
        self.niter = niter
        self.radius = radius
        self.power = power

    def __call__(self, xstart, xend, ystart, yend):
        self.x = np.linspace(xstart, xend, self.width)
        self.y = np.linspace(ystart, yend, self.height).reshape(-1, 1)
        c = self.x + 1.0j * self.y
        threshold_time = np.zeros((self.height, self.width))
        z = np.zeros(threshold_time.shape, dtype=np.complex)
        mask = np.ones(threshold_time.shape, dtype=np.bool)
        for i in range(self.niter):
            z[mask] = z[mask]**self.power + c[mask]
            mask = (np.abs(z) < self.radius)
            threshold_time += mask
        return threshold_time

    def ax_update(self, ax):
        ax.set_autoscale_on(False)  # Otherwise, infinite loop

        # Get the number of points from the number of pixels in the window
        dims = ax.axesPatch.get_window_extent().bounds
        self.width = int(dims[2] + 0.5)
        self.height = int(dims[2] + 0.5)

        # Get the range for the new area
        xstart, ystart, xdelta, ydelta = ax.viewLim.bounds
        xend = xstart + xdelta
        yend = ystart + ydelta

        # Update the image object with our new data and extent
        im = ax.images[-1]
        im.set_data(self.__call__(xstart, xend, ystart, yend))
        im.set_extent((xstart, xend, ystart, yend))
        ax.figure.canvas.draw_idle()

md = MandelbrotDisplay()
Z = md(-2., 0.5, -1.25, 1.25)

fig1, (ax1, ax2) = plt.subplots(1, 2)
ax1.imshow(Z, origin='lower', extent=(md.x.min(), md.x.max(), md.y.min(), md.y.max()))
ax2.imshow(Z, origin='lower', extent=(md.x.min(), md.x.max(), md.y.min(), md.y.max()))

rect = UpdatingRect([0, 0], 0, 0, facecolor='None', edgecolor='black', linewidth=1.0)
rect.set_bounds(*ax2.viewLim.bounds)
ax1.add_patch(rect)

# Connect for changing the view limits
ax2.callbacks.connect('xlim_changed', rect)
ax2.callbacks.connect('ylim_changed', rect)

ax2.callbacks.connect('xlim_changed', md.ax_update)
ax2.callbacks.connect('ylim_changed', md.ax_update)
ax2.set_title("Zoom here")

plt.show()
- 実行結果( viewlims.png )
Python 3.11.2 見直しました。上記のコードでは、下記のエラーが発生します。
Traceback (most recent call last):
File "_:\viewlims.py", line 61, in <module>
Z = md(-2., 0.5, -1.25, 1.25)
^^^^^^^^^^^^^^^^^^^^^^^^^
File "M:\usr\rehome10\Python\Py-Support\57_event_handling_Examples\19_viewlims\viewlims.py", line 33, in __call__
z = np.zeros(threshold_time.shape, dtype=np.complex)
^^^^^^^^^^
File "C:\Users\kamif\AppData\Local\Programs\Python\Python311\Lib\site-packages\numpy\__init__.py", line 305, in __getattr__
raise AttributeError(__former_attrs__[attr])
AttributeError: module 'numpy' has no attribute 'complex'.
`np.complex` was a deprecated alias for the builtin `complex`. To avoid this error in existing code, use `complex` by itself. Doing this will not modify any behavior and is safe. If you specifically wanted the numpy scalar type, use `np.complex128` here.
The aliases was originally deprecated in NumPy 1.20; for more details and guidance see the original release note at: https://numpy.org/devdocs/release/1.20.0-notes.html#deprecations. Did you mean: 'complex_'?
matplotlib 内部のエラーのようです。matplotlib の改修(先祖帰りバグの改修)を待つしかない。
Python 3.11.6 (matplotlib 3.7.1) では、下記のようなエラーがあり、実行できない。
Traceback (most recent call last): File "M:\______\viewlims.py", line 61, in
Python 3.12.0 (matplotlib 3.8.1) では、下記のようなエラーがあり、実行できない。Z = md(-2., 0.5, -1.25, 1.25) ^^^^^^^^^^^^^^^^^^^^^^^^^ File "M:\______\viewlims.py", line 33, in __call__ z = np.zeros(threshold_time.shape, dtype=np.complex) ^^^^^^^^^^ File "C:\Users\______\AppData\Local\Programs\Python \Python311\Lib\site-packages\numpy\__init__.py", line 305, in __getattr__ raise AttributeError(__former_attrs__[attr]) AttributeError: module 'numpy' has no attribute 'complex'. `np.complex` was a deprecated alias for the builtin `complex`. To avoid this error in existing code, use `complex` by itself. Doing this will not modify any behavior and is safe. If you specifically wanted the numpy scalar type, use `np.complex128` here. The aliases was originally deprecated in NumPy 1.20; for more details and guidance see the original release note at: https://numpy.org/devdocs/release/1.20.0-notes.html#deprecations. Did you mean: 'complex_'?
Traceback (most recent call last): File "E:\______\viewlims.py", line 61, in
Python 3.11.6 (matplotlib 3.7.1) 及び Python 3.12.0 (matplotlib 3.8.1) で、見直し中、新しいサンプル( event-handling-viewlims-py ) を見つけ、下記のコードで、正常に実行できました。Z = md(-2., 0.5, -1.25, 1.25) ^^^^^^^^^^^^^^^^^^^^^^^^^ File "E:\______\viewlims.py", line 33, in __call__ z = np.zeros(threshold_time.shape, dtype=np.complex) ^^^^^^^^^^ File "C:\Users\______\AppData\Roaming\Python \Python312\site-packages\numpy\__init__.py", line 338, in __getattr__ raise AttributeError(__former_attrs__[attr]) AttributeError: module 'numpy' has no attribute 'complex'. `np.complex` was a deprecated alias for the builtin `complex`. To avoid this error in existing code, use `complex` by itself. Doing this will not modify any behavior and is safe. If you specifically wanted the numpy scalar type, use `np.complex128` here. The aliases was originally deprecated in NumPy 1.20; for more details and guidance see the original release note at: https://numpy.org/devdocs/release/1.20.0-notes.html#deprecations. Did you mean: 'complex_'?
"""
========
Viewlims
========

Creates two identical panels.  Zooming in on the right panel will show
a rectangle in the first panel, denoting the zoomed region.

.. note::
    This example exercises the interactive capabilities of Matplotlib, and this
    will not appear in the static documentation. Please run this code on your
    machine to see the interactivity.

    You can copy and paste individual parts, or download the entire example
    using the link at the bottom of the page.
"""
import matplotlib.pyplot as plt
import numpy as np

from matplotlib.patches import Rectangle


# We just subclass Rectangle so that it can be called with an Axes
# instance, causing the rectangle to update its shape to match the
# bounds of the Axes
class UpdatingRect(Rectangle):
    def __call__(self, ax):
        self.set_bounds(*ax.viewLim.bounds)
        ax.figure.canvas.draw_idle()


# A class that will regenerate a fractal set as we zoom in, so that you
# can actually see the increasing detail.  A box in the left panel will show
# the area to which we are zoomed.
class MandelbrotDisplay:
    def __init__(self, h=500, w=500, niter=50, radius=2., power=2):
        self.height = h
        self.width = w
        self.niter = niter
        self.radius = radius
        self.power = power

    def compute_image(self, xstart, xend, ystart, yend):
        self.x = np.linspace(xstart, xend, self.width)
        self.y = np.linspace(ystart, yend, self.height).reshape(-1, 1)
        c = self.x + 1.0j * self.y
        threshold_time = np.zeros((self.height, self.width))
        z = np.zeros(threshold_time.shape, dtype=complex)
        mask = np.ones(threshold_time.shape, dtype=bool)
        for i in range(self.niter):
            z[mask] = z[mask]**self.power + c[mask]
            mask = (np.abs(z) < self.radius)
            threshold_time += mask
        return threshold_time

    def ax_update(self, ax):
        ax.set_autoscale_on(False)  # Otherwise, infinite loop
        # Get the number of points from the number of pixels in the window
        self.width, self.height = \
            np.round(ax.patch.get_window_extent().size).astype(int)
        # Get the range for the new area
        vl = ax.viewLim
        extent = vl.x0, vl.x1, vl.y0, vl.y1
        # Update the image object with our new data and extent
        im = ax.images[-1]
        im.set_data(self.compute_image(*extent))
        im.set_extent(extent)
        ax.figure.canvas.draw_idle()


md = MandelbrotDisplay()
Z = md.compute_image(-2., 0.5, -1.25, 1.25)

fig1, (ax1, ax2) = plt.subplots(1, 2)
ax1.imshow(Z, origin='lower',
           extent=(md.x.min(), md.x.max(), md.y.min(), md.y.max()))
ax2.imshow(Z, origin='lower',
           extent=(md.x.min(), md.x.max(), md.y.min(), md.y.max()))

rect = UpdatingRect(
    [0, 0], 0, 0, facecolor='none', edgecolor='black', linewidth=1.0)
rect.set_bounds(*ax2.viewLim.bounds)
ax1.add_patch(rect)

# Connect for changing the view limits
ax2.callbacks.connect('xlim_changed', rect)
ax2.callbacks.connect('ylim_changed', rect)

ax2.callbacks.connect('xlim_changed', md.ax_update)
ax2.callbacks.connect('ylim_changed', md.ax_update)
ax2.set_title("Zoom here")

plt.show()
Python 3.11.6 (matplotlib 3.7.1) 及び Python 3.12.0 (matplotlib 3.8.1) 共に、正常実行できる。

- 参照ページ
event_handling_Examples code: viewlims.py
event-handling-viewlims-py
- リリースノート
- 2023/11/14 Ver=1.04 Python 3.12.0 (matplotlib 3.8.1)で確認
- 2023/11/14 Ver=1.04 Python 3.11.6 (matplotlib 3.7.1)で確認
- 2023/03/30 Ver=1.03 Python 3.11.2 で確認
- 2020/10/30 Ver=1.01 Python 3.7.8 で確認
- 2018/11/25 Ver=1.01 初版リリース
- 関連ページ