|
|
event_handling_Examples 15_resample. |
H.Kamifuji . |
- resample.py
この事例は、Windows10_1909 で Python 3.9.0 環境では、動作しません。( データが表示されない。 )
この事例は、Windows10_22H2 で Python 3.11.29 環境でも、動作しません。( データが表示されない。 )
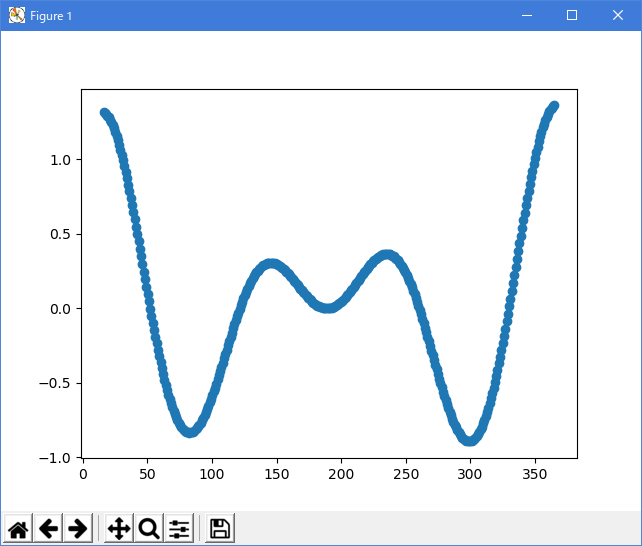
import numpy as np
import matplotlib.pyplot as plt


# A class that will downsample the data and recompute when zoomed.
class DataDisplayDownsampler(object):
    def __init__(self, xdata, ydata):
        self.origYData = ydata
        self.origXData = xdata
        self.ratio = 5
        self.delta = xdata[-1] - xdata[0]

    def downsample(self, xstart, xend):
        # Very simple downsampling that takes the points within the range
        # and picks every Nth point
        mask = (self.origXData > xstart) & (self.origXData 'lt; xend)
        xdata = self.origXData[mask]
        xdata = xdata[::self.ratio]

        ydata = self.origYData[mask]
        ydata = ydata[::self.ratio]

        return xdata, ydata

    def update(self, ax):
        # Update the line
        lims = ax.viewLim
        if np.abs(lims.width - self.delta) > 1e-8:
            self.delta = lims.width
            xstart, xend = lims.intervalx
            self.line.set_data(*self.downsample(xstart, xend))
            ax.figure.canvas.draw_idle()

# Create a signal
xdata = np.linspace(16, 365, 365-16)
ydata = np.sin(2*np.pi*xdata/153) + np.cos(2*np.pi*xdata/127)

d = DataDisplayDownsampler(xdata, ydata)

fig, ax = plt.subplots()

# Hook up the line
d.line, = ax.plot(xdata, ydata, 'o-')
ax.set_autoscale_on(False)  # Otherwise, infinite loop

# Connect for changing the view limits
ax.callbacks.connect('xlim_changed', d.update)

plt.show()
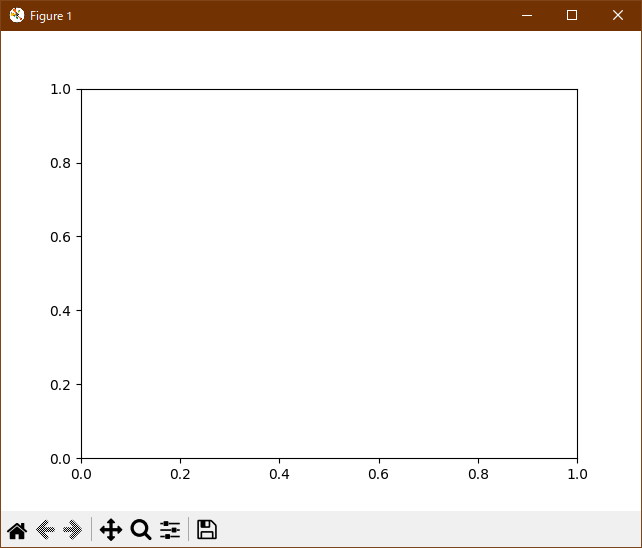
- 実行結果( resample.png )
Python 3.11.6 (matplotlib 3.7.1) 及び Python 3.12.0 (matplotlib 3.8.1) 共に、下図のように、データが表示されない。
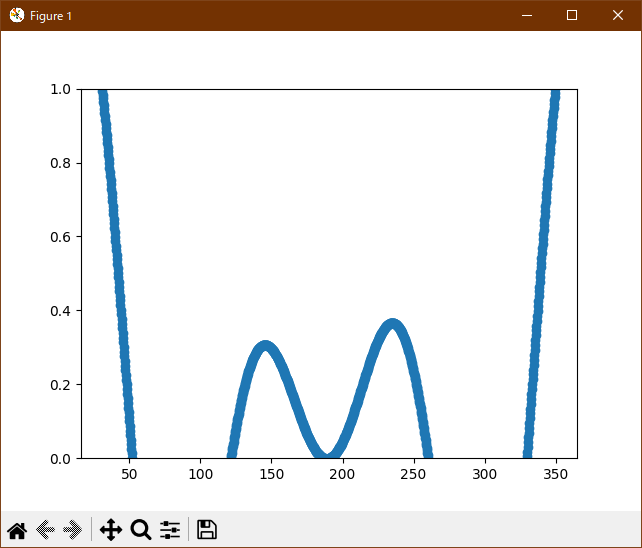
Python 3.11.6 (matplotlib 3.7.1) 及び Python 3.12.0 (matplotlib 3.8.1) で、見直し中、新しいサンプル(event-handling-resample-py) を見つけ、下記のコードで、正常に実行できました。
"""
===============
Resampling Data
===============

Downsampling lowers the sample rate or sample size of a signal. In
this tutorial, the signal is downsampled when the plot is adjusted
through dragging and zooming.

.. note::
    This example exercises the interactive capabilities of Matplotlib, and this
    will not appear in the static documentation. Please run this code on your
    machine to see the interactivity.

    You can copy and paste individual parts, or download the entire example
    using the link at the bottom of the page.
"""

import matplotlib.pyplot as plt
import numpy as np


# A class that will downsample the data and recompute when zoomed.
class DataDisplayDownsampler:
    def __init__(self, xdata, ydata):
        self.origYData = ydata
        self.origXData = xdata
        self.max_points = 50
        self.delta = xdata[-1] - xdata[0]

    def downsample(self, xstart, xend):
        # get the points in the view range
        mask = (self.origXData > xstart) & (self.origXData < xend)
        # dilate the mask by one to catch the points just outside
        # of the view range to not truncate the line
        mask = np.convolve([1, 1, 1], mask, mode='same').astype(bool)
        # sort out how many points to drop
        ratio = max(np.sum(mask) // self.max_points, 1)

        # mask data
        xdata = self.origXData[mask]
        ydata = self.origYData[mask]

        # downsample data
        xdata = xdata[::ratio]
        ydata = ydata[::ratio]

        print(f"using {len(ydata)} of {np.sum(mask)} visible points")

        return xdata, ydata

    def update(self, ax):
        # Update the line
        lims = ax.viewLim
        if abs(lims.width - self.delta) > 1e-8:
            self.delta = lims.width
            xstart, xend = lims.intervalx
            self.line.set_data(*self.downsample(xstart, xend))
            ax.figure.canvas.draw_idle()


# Create a signal
xdata = np.linspace(16, 365, (365-16)*4)
ydata = np.sin(2*np.pi*xdata/153) + np.cos(2*np.pi*xdata/127)

d = DataDisplayDownsampler(xdata, ydata)

fig, ax = plt.subplots()

# Hook up the line
d.line, = ax.plot(xdata, ydata, 'o-')
ax.set_autoscale_on(False)  # Otherwise, infinite loop

# Connect for changing the view limits
ax.callbacks.connect('xlim_changed', d.update)
ax.set_xlim(16, 365)
plt.show()
Python 3.11.6 (matplotlib 3.7.1) 及び Python 3.12.0 (matplotlib 3.8.1) 共に、正常に、実行できる。
- 参照ページ
event_handling_Examples code: resample.py
event-handling-resample-py
- リリースノート
- 2023/11/14 Ver=1.04 Python 3.12.0 (matplotlib 3.8.1)で確認
- 2023/11/14 Ver=1.04 Python 3.11.6 (matplotlib 3.7.1)で確認
- 2023/03/29 Ver=1.03 Python 3.11.2 で確認
- 2020/10/30 Ver=1.01 Python 3.7.8 で確認
- 2018/11/25 Ver=1.01 初版リリース
- 関連ページ