|
|
matplotlib axes_grid_Examples 22_simple_axesgrid2. |
H.Kamifuji . |
- simple_axesgrid2.py
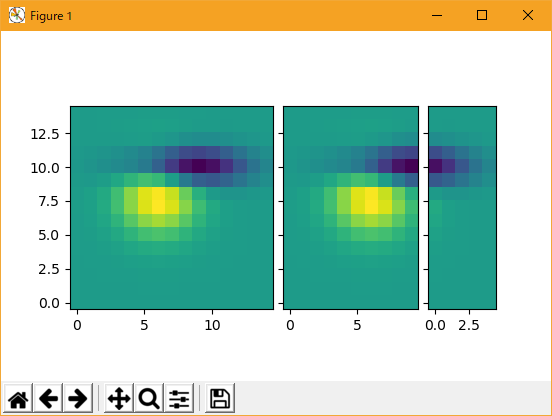
import matplotlib.pyplot as plt
from mpl_toolkits.axes_grid1 import ImageGrid


def get_demo_image():
    import numpy as np
    from matplotlib.cbook import get_sample_data
    f = get_sample_data("axes_grid/bivariate_normal.npy", asfileobj=False)
    z = np.load(f)
    # z is a numpy array of 15x15
    return z, (-3, 4, -4, 3)

F = plt.figure(1, (5.5, 3.5))
grid = ImageGrid(F, 111,  # similar to subplot(111)
                 nrows_ncols=(1, 3),
                 axes_pad=0.1,
                 add_all=True,
                 label_mode="L",
                 )

Z, extent = get_demo_image()  # demo image

im1 = Z
im2 = Z[:, :10]
im3 = Z[:, 10:]
vmin, vmax = Z.min(), Z.max()
for i, im in enumerate([im1, im2, im3]):
    ax = grid[i]
    ax.imshow(im, origin="lower", vmin=vmin,
              vmax=vmax, interpolation="nearest")

plt.draw()
plt.show()
- 実行結果( simple_axesgrid2.png )
Python 3.11.2 見直しました。上記のコードでは、下記のエラーが発生します。
Traceback (most recent call last):
File "_:\simple_axesgrid2.py", line 14, in <module>
grid = ImageGrid(F, 111, # similar to subplot(111)
^^^^^^^^^^^^^^^^^^^^^^^^^^^^^^^^^^^^^^^^^^^^
TypeError: ImageGrid.__init__() got an unexpected keyword argument 'add_all'
matplotlib 内部のエラーのようです。matplotlib の改修(先祖帰りバグの改修)を待つしかない。
Python 3.11.6 (matplotlib 3.7.1) では、下記のようなエラーがあり、実行できない。
Traceback (most recent call last): File "M:\_____\simple_axesgrid2.py", line 14, in
Python 3.12.0 (matplotlib 3.8.1) では、下記のようなエラーがあり、実行できない。grid = ImageGrid(F, 111, # similar to subplot(111) ^^^^^^^^^^^^^^^^^^^^^^^^^^^^^^^^^^^^^^^^^^^^ TypeError: ImageGrid.__init__() got an unexpected keyword argument 'add_all'
Traceback (most recent call last): File "E:\______\simple_axesgrid2.py", line 14, in
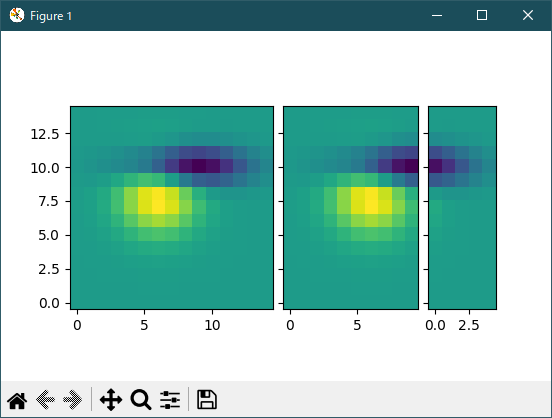
Python 3.11.6 (matplotlib 3.7.1) 及び Python 3.12.0 (matplotlib 3.8.1) で、見直し中、新しいサンプル(simple-axesgrid2-py) を見つけ、下記のコードで、正常に実行できました。grid = ImageGrid(F, 111, # similar to subplot(111) ^^^^^^^^^^^^^^^^^^^^^^^^^^^^^^^^^^^^^^^^^^^^ TypeError: ImageGrid.__init__() got an unexpected keyword argument 'add_all'
import matplotlib.pyplot as plt

from matplotlib import cbook
from mpl_toolkits.axes_grid1 import ImageGrid

fig = plt.figure(figsize=(5.5, 3.5))
grid = ImageGrid(fig, 111,  # similar to subplot(111)
                 nrows_ncols=(1, 3),
                 axes_pad=0.1,
                 label_mode="L",
                 )

# demo image
Z = cbook.get_sample_data("axes_grid/bivariate_normal.npy")
im1 = Z
im2 = Z[:, :10]
im3 = Z[:, 10:]
vmin, vmax = Z.min(), Z.max()
for ax, im in zip(grid, [im1, im2, im3]):
    ax.imshow(im, origin="lower", vmin=vmin, vmax=vmax)

plt.show()
Python 3.11.6 (matplotlib 3.7.1) では、下記のようなエラーがあり、実行できない。
M:\______\simple_axesgrid2_2.py:14: MatplotlibDeprecationWarning: In a future release, get_sample_data will automatically load numpy arrays. Set np_load to True to get the array and suppress this warning. Set asfileobj to False to get the path to the data file and suppress this warning. Z = cbook.get_sample_data("axes_grid/bivariate_normal.npy") Traceback (most recent call last): File "M:\______\simple_axesgrid2_2.py", line 16, inPython 3.12.0 (matplotlib 3.8.1) では、正常に、実行できる。im2 = Z[:, :10] ~^^^^^^^^ TypeError: '_io.BufferedReader' object is not subscriptable
- 参照ページ
axes_grid_Examples code: simple_axesgrid2.py
simple-axesgrid2-py
- リリースノート
- 2023/11/13 Ver=1.04 Python 3.12.0 (matplotlib 3.8.1)で確認
- 2023/11/13 Ver=1.04 Python 3.11.6 (matplotlib 3.7.1)で確認
- 2023/03/28 Ver=1.03 Python 3.11.2 で確認
- 2020/10/30 Ver=1.01 Python 3.7.8 で確認
- 2018/11/24 Ver=1.01 初版リリース
- 関連ページ