|
|
matplotlib axes_grid_Examples 09_demo_curvelinear_grid2. |
H.Kamifuji . |
- demo_curvelinear_grid2.py
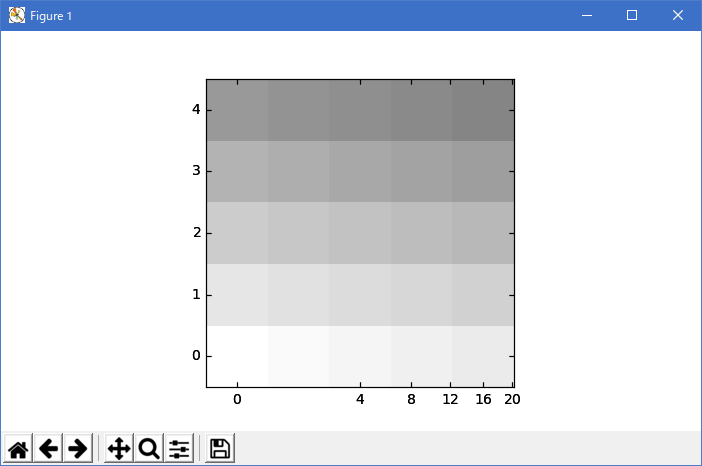
この例では、GridHelperCurveLinear を使用して、グリッドに変形を適用してカスタムグリッドとティックラインを定義する方法を示します。 プロット上に示されるように、5x5 の行列が軸に表示されます。
"""
Custom grid and ticklines.

This example demonstrates how to use GridHelperCurveLinear to define
custom grids and ticklines by applying a transformation on the grid.
As showcase on the plot, a 5x5 matrix is displayed on the axes.
"""

import numpy as np
import matplotlib.pyplot as plt

from mpl_toolkits.axes_grid.grid_helper_curvelinear import \
    GridHelperCurveLinear
from mpl_toolkits.axes_grid.axislines import Subplot

import mpl_toolkits.axes_grid.angle_helper as angle_helper


def curvelinear_test1(fig):
    """
    grid for custom transform.
    """

    def tr(x, y):
        sgn = np.sign(x)
        x, y = np.abs(np.asarray(x)), np.asarray(y)
        return sgn*x**.5, y

    def inv_tr(x, y):
        sgn = np.sign(x)
        x, y = np.asarray(x), np.asarray(y)
        return sgn*x**2, y

    extreme_finder = angle_helper.ExtremeFinderCycle(20, 20,
                                                     lon_cycle=None,
                                                     lat_cycle=None,
                                                     # (0, np.inf),
                                                     lon_minmax=None,
                                                     lat_minmax=None,
                                                     )

    grid_helper = GridHelperCurveLinear((tr, inv_tr),
                                        extreme_finder=extreme_finder)

    ax1 = Subplot(fig, 111, grid_helper=grid_helper)
    # ax1 will have a ticks and gridlines defined by the given
    # transform (+ transData of the Axes). Note that the transform of
    # the Axes itself (i.e., transData) is not affected by the given
    # transform.

    fig.add_subplot(ax1)

    ax1.imshow(np.arange(25).reshape(5, 5),
               vmax=50, cmap=plt.cm.gray_r,
               interpolation="nearest",
               origin="lower")

    # tick density
    grid_helper.grid_finder.grid_locator1._nbins = 6
    grid_helper.grid_finder.grid_locator2._nbins = 6


if 1:
    fig = plt.figure(1, figsize=(7, 4))
    fig.clf()

    curvelinear_test1(fig)
    plt.show()
- 実行結果( demo_curvelinear_grid2.png )
Python 3.11.2 見直しました。上記のコードでは、下記のエラーが発生します。
Traceback (most recent call last):
File "_:\demo_curvelinear_grid2.py", line 12, in <module>
from mpl_toolkits.axes_grid.grid_helper_curvelinear import \
ModuleNotFoundError: No module named 'mpl_toolkits.axes_grid'
matplotlib 内部のエラーのようです。matplotlib の改修(先祖帰りバグの改修)を待つしかない。
Python 3.11.6 (matplotlib 3.7.1) では、下記のようなエラーがあり、実行できない。
Traceback (most recent call last): File "M:\_____\demo_curvelinear_grid2.py", line 12, in
Python 3.12.0 (matplotlib 3.8.1) では、下記のようなエラーがあり、実行できない。from mpl_toolkits.axes_grid.grid_helper_curvelinear import \ ModuleNotFoundError: No module named 'mpl_toolkits.axes_grid'
Traceback (most recent call last): File "E:\______\demo_curvelinear_grid2.py", line 12, in
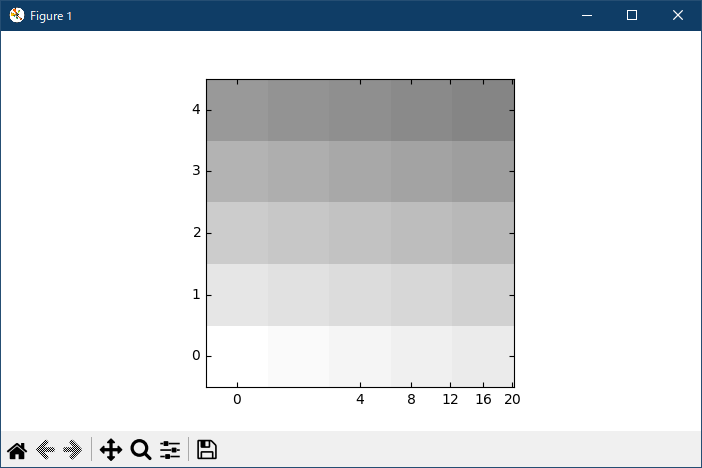
Python 3.11.6 (matplotlib 3.7.1) 及び Python 3.12.0 (matplotlib 3.8.1) で、見直し中、新しいサンプル(axisartist-demo-curvelinear-grid2-py) を見つけ、下記のコードで、正常に実行できました。from mpl_toolkits.axes_grid.grid_helper_curvelinear import \ ModuleNotFoundError: No module named 'mpl_toolkits.axes_grid'
"""
======================
Demo CurveLinear Grid2
======================

Custom grid and ticklines.

This example demonstrates how to use GridHelperCurveLinear to define
custom grids and ticklines by applying a transformation on the grid.
As showcase on the plot, a 5x5 matrix is displayed on the axes.
"""

import matplotlib.pyplot as plt
import numpy as np

from mpl_toolkits.axisartist.axislines import Axes
from mpl_toolkits.axisartist.grid_finder import (ExtremeFinderSimple,
                                                 MaxNLocator)
from mpl_toolkits.axisartist.grid_helper_curvelinear import \
    GridHelperCurveLinear


def curvelinear_test1(fig):
    """Grid for custom transform."""

    def tr(x, y):
        return np.sign(x)*abs(x)**.5, y

    def inv_tr(x, y):
        return np.sign(x)*x**2, y

    grid_helper = GridHelperCurveLinear(
        (tr, inv_tr),
        extreme_finder=ExtremeFinderSimple(20, 20),
        # better tick density
        grid_locator1=MaxNLocator(nbins=6), grid_locator2=MaxNLocator(nbins=6))

    ax1 = fig.add_subplot(axes_class=Axes, grid_helper=grid_helper)
    # ax1 will have a ticks and gridlines defined by the given
    # transform (+ transData of the Axes). Note that the transform of the Axes
    # itself (i.e., transData) is not affected by the given transform.

    ax1.imshow(np.arange(25).reshape(5, 5),
               vmax=50, cmap=plt.cm.gray_r, origin="lower")


if __name__ == "__main__":
    fig = plt.figure(figsize=(7, 4))
    curvelinear_test1(fig)
    plt.show()
Python 3.11.6 (matplotlib 3.7.1) 及び Python 3.12.0 (matplotlib 3.8.1) 共に、正常に、実行できる。
- 参照ページ
axes_grid_Examples code: demo_curvelinear_grid2.py
axisartist-demo-curvelinear-grid2-py
- リリースノート
- 2023/11/13 Ver=1.04 Python 3.12.0 (matplotlib 3.8.1)で確認
- 2023/11/13 Ver=1.04 Python 3.11.6 (matplotlib 3.7.1)で確認
- 2023/03/28 Ver=1.03 Python 3.11.2 で確認
- 2020/10/30 Ver=1.01 Python 3.7.8 で確認
- 2018/11/24 Ver=1.01 初版リリース
- 関連ページ