|
|
matplotlib axes_grid_Examples 06_demo_axisline_style. |
H.Kamifuji . |
- demo_axisline_style.py
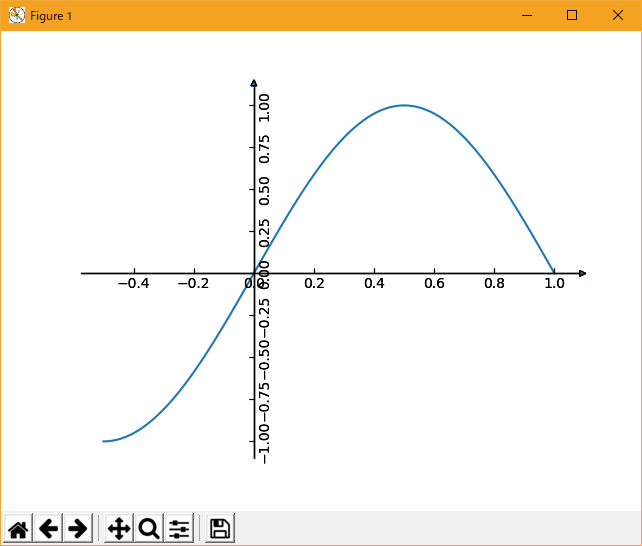
from mpl_toolkits.axes_grid.axislines import SubplotZero
import matplotlib.pyplot as plt
import numpy as np

if 1:
    fig = plt.figure(1)
    ax = SubplotZero(fig, 111)
    fig.add_subplot(ax)

    for direction in ["xzero", "yzero"]:
        ax.axis[direction].set_axisline_style("-|>")
        ax.axis[direction].set_visible(True)

    for direction in ["left", "right", "bottom", "top"]:
        ax.axis[direction].set_visible(False)

    x = np.linspace(-0.5, 1., 100)
    ax.plot(x, np.sin(x*np.pi))

    plt.show()
- 実行結果( demo_axisline_style.png )
Python 3.11.2 見直しました。上記のコードでは、下記のエラーが発生します。
Traceback (most recent call last):
File "_:\demo_axisline_style.py", line 1, in <module>
from mpl_toolkits.axes_grid.axislines import SubplotZero
ModuleNotFoundError: No module named 'mpl_toolkits.axes_grid'
matplotlib 内部のエラーのようです。matplotlib の改修(先祖帰りバグの改修)を待つしかない。
Python 3.11.6 (matplotlib 3.7.1) では、下記のようなエラーがあり、実行できない。
Traceback (most recent call last): File "M:\______\demo_axisline_style.py", line 1, in
Python 3.12.0 (matplotlib 3.8.1) では、下記のようなエラーがあり、実行できない。from mpl_toolkits.axes_grid.axislines import SubplotZero ModuleNotFoundError: No module named 'mpl_toolkits.axes_grid'
Traceback (most recent call last): File "E:\______\demo_axisline_style.py", line 1, in
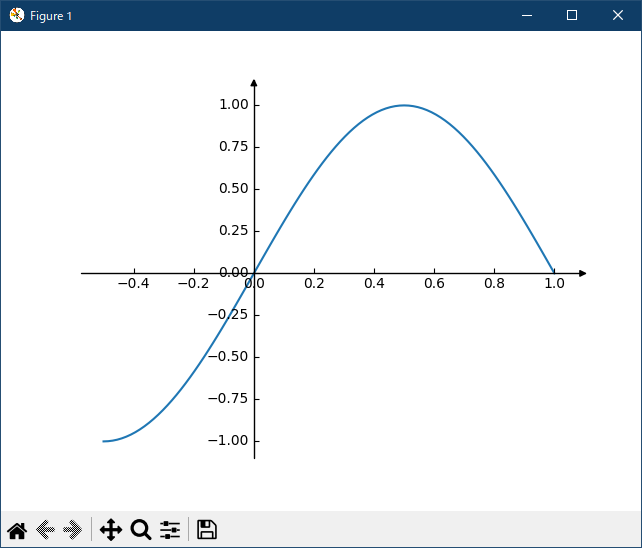
Python 3.11.6 (matplotlib 3.7.1) 及び Python 3.12.0 (matplotlib 3.8.1) で、見直し中、新しいサンプル(demo-axisline-style-py) を見つけ、下記のコードで、正常に実行できました。from mpl_toolkits.axes_grid.axislines import SubplotZero ModuleNotFoundError: No module named 'mpl_toolkits.axes_grid'
"""
================
Axis line styles
================

This example shows some configurations for axis style.

Note: The `mpl_toolkits.axisartist` axes classes may be confusing for new
users. If the only aim is to obtain arrow heads at the ends of the axes,
rather check out the :doc:`/gallery/spines/centered_spines_with_arrows`
example.
"""

import matplotlib.pyplot as plt
import numpy as np

from mpl_toolkits.axisartist.axislines import AxesZero

fig = plt.figure()
ax = fig.add_subplot(axes_class=AxesZero)

for direction in ["xzero", "yzero"]:
    # adds arrows at the ends of each axis
    ax.axis[direction].set_axisline_style("-|>")

    # adds X and Y-axis from the origin
    ax.axis[direction].set_visible(True)

for direction in ["left", "right", "bottom", "top"]:
    # hides borders
    ax.axis[direction].set_visible(False)

x = np.linspace(-0.5, 1., 100)
ax.plot(x, np.sin(x*np.pi))

plt.show()
Python 3.11.6 (matplotlib 3.7.1) 及び Python 3.12.0 (matplotlib 3.8.1) 共に、正常に、実行できる。
- 参照ページ
axes_grid_Examples code: demo_axisline_style.py
demo-axisline-style-py
- リリースノート
- 2023/03/28 Ver=1.03 Python 3.11.2 で確認
- 2020/10/30 Ver=1.01 Python 3.7.8 で確認
- 2018/11/24 Ver=1.01 初版リリース
- 関連ページ