|
|
matplotlib axes_grid_Examples 03_demo_axes_grid2. |
H.Kamifuji . |
- demo_axes_grid2.py
Python 3.11.6 (matplotlib 3.7.1) 及び Python 3.12.0 (matplotlib 3.8.1) で、見直し中。
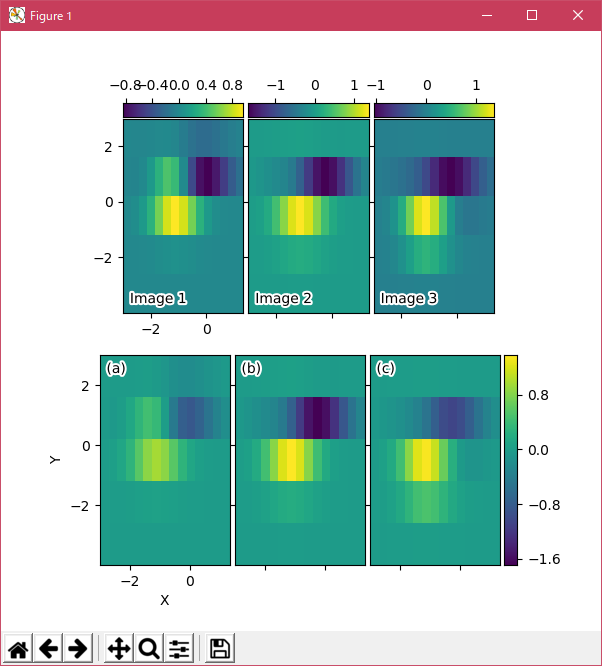
import matplotlib.pyplot as plt
from mpl_toolkits.axes_grid1 import ImageGrid
import numpy as np


def get_demo_image():
    from matplotlib.cbook import get_sample_data
    f = get_sample_data("axes_grid/bivariate_normal.npy", asfileobj=False)
    z = np.load(f)
    # z is a numpy array of 15x15
    return z, (-3, 4, -4, 3)


def add_inner_title(ax, title, loc, size=None, **kwargs):
    from matplotlib.offsetbox import AnchoredText
    from matplotlib.patheffects import withStroke
    if size is None:
        size = dict(size=plt.rcParams['legend.fontsize'])
    at = AnchoredText(title, loc=loc, prop=size,
                      pad=0., borderpad=0.5,
                      frameon=False, **kwargs)
    ax.add_artist(at)
    at.txt._text.set_path_effects([withStroke(foreground="w", linewidth=3)])
    return at

if 1:
    F = plt.figure(1, (6, 6))
    F.clf()

    # prepare images
    Z, extent = get_demo_image()
    ZS = [Z[i::3, :] for i in range(3)]
    extent = extent[0], extent[1]/3., extent[2], extent[3]

    # demo 1 : colorbar at each axes

    grid = ImageGrid(F, 211,  # similar to subplot(111)
                     nrows_ncols=(1, 3),
                     direction="row",
                     axes_pad=0.05,
                     add_all=True,
                     label_mode="1",
                     share_all=True,
                     cbar_location="top",
                     cbar_mode="each",
                     cbar_size="7%",
                     cbar_pad="1%",
                     )

    for ax, z in zip(grid, ZS):
        im = ax.imshow(
            z, origin="lower", extent=extent, interpolation="nearest")
        ax.cax.colorbar(im)

    for ax, im_title in zip(grid, ["Image 1", "Image 2", "Image 3"]):
        t = add_inner_title(ax, im_title, loc=3)
        t.patch.set_alpha(0.5)

    for ax, z in zip(grid, ZS):
        ax.cax.toggle_label(True)
        #axis = ax.cax.axis[ax.cax.orientation]
        #axis.label.set_text("counts s$^{-1}$")
        #axis.label.set_size(10)
        #axis.major_ticklabels.set_size(6)

    # changing the colorbar ticks
    grid[1].cax.set_xticks([-1, 0, 1])
    grid[2].cax.set_xticks([-1, 0, 1])

    grid[0].set_xticks([-2, 0])
    grid[0].set_yticks([-2, 0, 2])

    # demo 2 : shared colorbar

    grid2 = ImageGrid(F, 212,
                      nrows_ncols=(1, 3),
                      direction="row",
                      axes_pad=0.05,
                      add_all=True,
                      label_mode="1",
                      share_all=True,
                      cbar_location="right",
                      cbar_mode="single",
                      cbar_size="10%",
                      cbar_pad=0.05,
                      )

    grid2[0].set_xlabel("X")
    grid2[0].set_ylabel("Y")

    vmax, vmin = np.max(ZS), np.min(ZS)
    import matplotlib.colors
    norm = matplotlib.colors.Normalize(vmax=vmax, vmin=vmin)

    for ax, z in zip(grid2, ZS):
        im = ax.imshow(z, norm=norm,
                       origin="lower", extent=extent,
                       interpolation="nearest")

    # With cbar_mode="single", cax attribute of all axes are identical.
    ax.cax.colorbar(im)
    ax.cax.toggle_label(True)

    for ax, im_title in zip(grid2, ["(a)", "(b)", "(c)"]):
        t = add_inner_title(ax, im_title, loc=2)
        t.patch.set_ec("none")
        t.patch.set_alpha(0.5)

    grid2[0].set_xticks([-2, 0])
    grid2[0].set_yticks([-2, 0, 2])

    plt.draw()
    plt.show()
- 実行結果( demo_axes_grid2.png )
Python 3.11.2 見直しました。上記のコードでは、下記のエラーが発生します。
TypeError: FigureBase.gca() got an unexpected keyword argument 'projection'
Traceback (most recent call last):
File "_:\demo_axes_grid2.py", line 37, in <module>
grid = ImageGrid(F, 211, # similar to subplot(111)
^^^^^^^^^^^^^^^^^^^^^^^^^^^^^^^^^^^^^^^^^^^^
TypeError: ImageGrid.__init__() got an unexpected keyword argument 'add_all'
matplotlib 内部のエラーのようです。matplotlib の改修(先祖帰りバグの改修)を待つしかない。
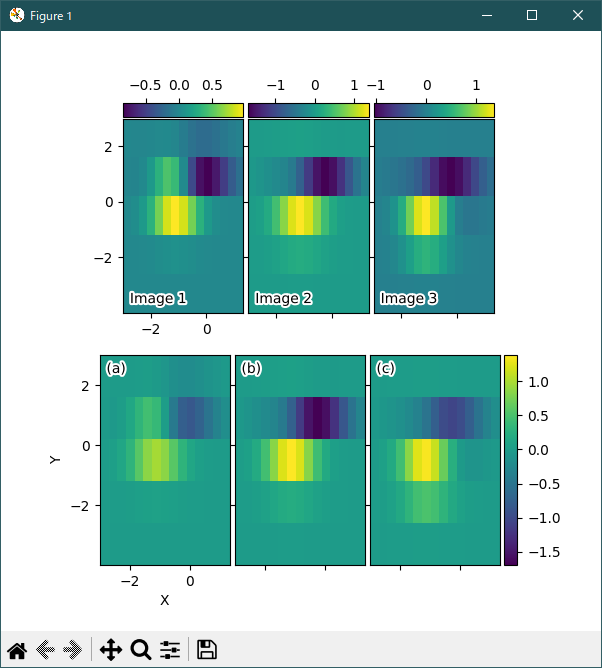
Python 3.11.6 (matplotlib 3.7.1) 及び Python 3.12.0 (matplotlib 3.8.1) で、見直し中、新しいサンプル(demo-axes-grid2-py) を見つけ、下記のコードで、正常に実行できました。
import matplotlib.pyplot as plt
import numpy as np

from matplotlib import cbook
from mpl_toolkits.axes_grid1 import ImageGrid


def add_inner_title(ax, title, loc, **kwargs):
    from matplotlib.offsetbox import AnchoredText
    from matplotlib.patheffects import withStroke
    prop = dict(path_effects=[withStroke(foreground='w', linewidth=3)],
                size=plt.rcParams['legend.fontsize'])
    at = AnchoredText(title, loc=loc, prop=prop,
                      pad=0., borderpad=0.5,
                      frameon=False, **kwargs)
    ax.add_artist(at)
    return at


fig = plt.figure(figsize=(6, 6))

# Prepare images
Z = cbook.get_sample_data("axes_grid/bivariate_normal.npy")
extent = (-3, 4, -4, 3)
ZS = [Z[i::3, :] for i in range(3)]
extent = extent[0], extent[1]/3., extent[2], extent[3]

# *** Demo 1: colorbar at each axes ***
grid = ImageGrid(
    # 211 = at the position of fig.add_subplot(211)
    fig, 211, nrows_ncols=(1, 3), axes_pad=0.05, label_mode="1", share_all=True,
    cbar_location="top", cbar_mode="each", cbar_size="7%", cbar_pad="1%")
grid[0].set(xticks=[-2, 0], yticks=[-2, 0, 2])

for i, (ax, z) in enumerate(zip(grid, ZS)):
    im = ax.imshow(z, origin="lower", extent=extent)
    cb = ax.cax.colorbar(im)
    # Changing the colorbar ticks
    if i in [1, 2]:
        cb.set_ticks([-1, 0, 1])

for ax, im_title in zip(grid, ["Image 1", "Image 2", "Image 3"]):
    add_inner_title(ax, im_title, loc='lower left')

# *** Demo 2: shared colorbar ***
grid2 = ImageGrid(
    fig, 212, nrows_ncols=(1, 3), axes_pad=0.05, label_mode="1", share_all=True,
    cbar_location="right", cbar_mode="single", cbar_size="10%", cbar_pad=0.05)
grid2[0].set(xlabel="X", ylabel="Y", xticks=[-2, 0], yticks=[-2, 0, 2])

clim = (np.min(ZS), np.max(ZS))
for ax, z in zip(grid2, ZS):
    im = ax.imshow(z, clim=clim, origin="lower", extent=extent)

# With cbar_mode="single", cax attribute of all axes are identical.
ax.cax.colorbar(im)

for ax, im_title in zip(grid2, ["(a)", "(b)", "(c)"]):
    add_inner_title(ax, im_title, loc='upper left')

plt.show()
Python 3.11.6 (matplotlib 3.7.1) では、下記のようなエラーがあり、実行できない。
M:\______\demo_axes_grid2_2.py:23: MatplotlibDeprecationWarning: In a future release, get_sample_data will automatically load numpy arrays. Set np_load to True to get the array and suppress this warning. Set asfileobj to False to get the path to the data file and suppress this warning. Z = cbook.get_sample_data("axes_grid/bivariate_normal.npy") Traceback (most recent call last): File "M:\______\demo_axes_grid2_2.py", line 25, inPython 3.12.0 (matplotlib 3.8.1) では、正常に、実行できる。ZS = [Z[i::3, :] for i in range(3)] ^^^^^^^^^^^^^^^^^^^^^^^^^^^^^^ File "M:\______\demo_axes_grid2_2.py", line 25, in ZS = [Z[i::3, :] for i in range(3)] ~^^^^^^^^^ TypeError: '_io.BufferedReader' object is not subscriptable
- 参照ページ
axes_grid_Examples code: demo_axes_grid2.py
demo-axes-grid2-py
- リリースノート
- 2023/11/11 Ver=1.04 Python 3.12.0 (matplotlib 3.8.1)で確認
- 2023/11/11 Ver=1.04 Python 3.11.6 (matplotlib 3.7.1)で確認
- 2023/03/28 Ver=1.03 Python 3.11.2 で確認
- 2020/10/30 Ver=1.01 Python 3.7.8 で確認
- 2018/11/24 Ver=1.01 初版リリース
- 関連ページ