|
|
matplotlib axes_grid_Examples 01_demo_axes_divider. |
H.Kamifuji . |
- demo_axes_divider.py
この事例は、Windows10_1909 で Python 3.9.0 環境では、動作しません。( ImportError: cannot import name 'LocatableAxes' from 'mpl_toolkits.axes_grid1' が削除されたのか? )
The LocatableAxes class was deprecated in Matplotlib 3.0 and will be removed in 3.2. と 2.7.x で予告されていたような!
Python 3.11.6 (matplotlib 3.7.1) 及び Python 3.12.0 (matplotlib 3.8.1) で、見直し中。
import matplotlib.pyplot as plt

def get_demo_image():
    import numpy as np
    from matplotlib.cbook import get_sample_data
    f = get_sample_data("axes_grid/bivariate_normal.npy", asfileobj=False)
    z = np.load(f)
    # z is a numpy array of 15x15
    return z, (-3, 4, -4, 3)


def demo_simple_image(ax):
    Z, extent = get_demo_image()

    im = ax.imshow(Z, extent=extent, interpolation="nearest")
    cb = plt.colorbar(im)
    plt.setp(cb.ax.get_yticklabels(), visible=False)


def demo_locatable_axes_hard(fig1):

    from mpl_toolkits.axes_grid1 \
        import SubplotDivider, LocatableAxes, Size

    divider = SubplotDivider(fig1, 2, 2, 2, aspect=True)

    # axes for image
    ax = LocatableAxes(fig1, divider.get_position())

    # axes for colorbar
    ax_cb = LocatableAxes(fig1, divider.get_position())

    h = [Size.AxesX(ax),  # main axes
         Size.Fixed(0.05),  # padding, 0.1 inch
         Size.Fixed(0.2),  # colorbar, 0.3 inch
         ]

    v = [Size.AxesY(ax)]

    divider.set_horizontal(h)
    divider.set_vertical(v)

    ax.set_axes_locator(divider.new_locator(nx=0, ny=0))
    ax_cb.set_axes_locator(divider.new_locator(nx=2, ny=0))

    fig1.add_axes(ax)
    fig1.add_axes(ax_cb)

    ax_cb.axis["left"].toggle(all=False)
    ax_cb.axis["right"].toggle(ticks=True)

    Z, extent = get_demo_image()

    im = ax.imshow(Z, extent=extent, interpolation="nearest")
    plt.colorbar(im, cax=ax_cb)
    plt.setp(ax_cb.get_yticklabels(), visible=False)


def demo_locatable_axes_easy(ax):
    from mpl_toolkits.axes_grid1 import make_axes_locatable

    divider = make_axes_locatable(ax)

    ax_cb = divider.new_horizontal(size="5%", pad=0.05)
    fig1 = ax.get_figure()
    fig1.add_axes(ax_cb)

    Z, extent = get_demo_image()
    im = ax.imshow(Z, extent=extent, interpolation="nearest")

    plt.colorbar(im, cax=ax_cb)
    ax_cb.yaxis.tick_right()
    for tl in ax_cb.get_yticklabels():
        tl.set_visible(False)
    ax_cb.yaxis.tick_right()


def demo_images_side_by_side(ax):
    from mpl_toolkits.axes_grid1 import make_axes_locatable

    divider = make_axes_locatable(ax)

    Z, extent = get_demo_image()
    ax2 = divider.new_horizontal(size="100%", pad=0.05)
    fig1 = ax.get_figure()
    fig1.add_axes(ax2)

    ax.imshow(Z, extent=extent, interpolation="nearest")
    ax2.imshow(Z, extent=extent, interpolation="nearest")
    for tl in ax2.get_yticklabels():
        tl.set_visible(False)


def demo():

    fig1 = plt.figure(1, (6, 6))
    fig1.clf()

    # PLOT 1
    # simple image & colorbar
    ax = fig1.add_subplot(2, 2, 1)
    demo_simple_image(ax)

    # PLOT 2
    # image and colorbar whose location is adjusted in the drawing time.
    # a hard way

    demo_locatable_axes_hard(fig1)

    # PLOT 3
    # image and colorbar whose location is adjusted in the drawing time.
    # a easy way

    ax = fig1.add_subplot(2, 2, 3)
    demo_locatable_axes_easy(ax)

    # PLOT 4
    # two images side by side with fixed padding.

    ax = fig1.add_subplot(2, 2, 4)
    demo_images_side_by_side(ax)

    plt.draw()
    plt.show()


demo()
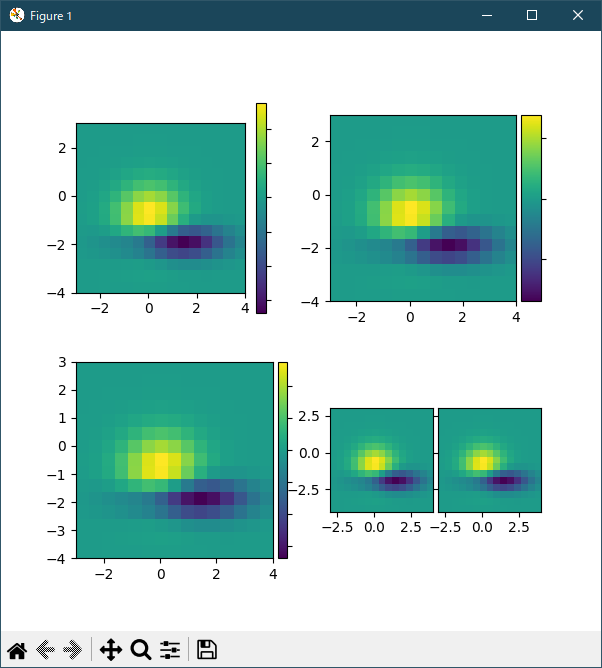
- 実行結果( demo_axes_divider.png )

Python 3.11.2 見直しました。上記のコードでは、下記のエラーが発生します。
TypeError: FigureBase.gca() got an unexpected keyword argument 'projection'
Traceback (most recent call last):
File "_:\demo_axes_divider.py", line 128, in <module>
demo()
File "_:\demo_axes_divider.py", line 109, in demo
demo_locatable_axes_hard(fig1)
File "_:\demo_axes_divider.py", line 23, in demo_locatable_axes_hard
from mpl_toolkits.axes_grid1 \
ImportError: cannot import name 'LocatableAxes' from 'mpl_toolkits.axes_grid1' (C:\Users\kamif\AppData\Local\Programs\Python\Python311\Lib\site-packages\mpl_toolkits\axes_grid1\__init__.py)
matplotlib 内部のエラーのようです。matplotlib の改修(先祖帰りバグの改修)を待つしかない。
Python 3.11.6 (matplotlib 3.7.1) 及び Python 3.12.0 (matplotlib 3.8.1) で、見直し中、新しいサンプル(demo-axes-divider-py) を見つけ、下記のコードで、確認します。
"""
============
Axes divider
============

Axes divider to calculate location of axes and
create a divider for them using existing axes instances.
"""

import matplotlib.pyplot as plt

from matplotlib import cbook


def get_demo_image():
    z = cbook.get_sample_data("axes_grid/bivariate_normal.npy")  # 15x15 array
    return z, (-3, 4, -4, 3)


def demo_simple_image(ax):
    Z, extent = get_demo_image()

    im = ax.imshow(Z, extent=extent)
    cb = plt.colorbar(im)
    cb.ax.yaxis.set_tick_params(labelright=False)


def demo_locatable_axes_hard(fig):
    from mpl_toolkits.axes_grid1 import Size, SubplotDivider

    divider = SubplotDivider(fig, 2, 2, 2, aspect=True)

    # axes for image
    ax = fig.add_subplot(axes_locator=divider.new_locator(nx=0, ny=0))
    # axes for colorbar
    ax_cb = fig.add_subplot(axes_locator=divider.new_locator(nx=2, ny=0))

    divider.set_horizontal([
        Size.AxesX(ax),  # main axes
        Size.Fixed(0.05),  # padding, 0.1 inch
        Size.Fixed(0.2),  # colorbar, 0.3 inch
    ])
    divider.set_vertical([Size.AxesY(ax)])

    Z, extent = get_demo_image()

    im = ax.imshow(Z, extent=extent)
    plt.colorbar(im, cax=ax_cb)
    ax_cb.yaxis.set_tick_params(labelright=False)


def demo_locatable_axes_easy(ax):
    from mpl_toolkits.axes_grid1 import make_axes_locatable

    divider = make_axes_locatable(ax)

    ax_cb = divider.append_axes("right", size="5%", pad=0.05)
    fig = ax.get_figure()
    fig.add_axes(ax_cb)

    Z, extent = get_demo_image()
    im = ax.imshow(Z, extent=extent)

    plt.colorbar(im, cax=ax_cb)
    ax_cb.yaxis.tick_right()
    ax_cb.yaxis.set_tick_params(labelright=False)


def demo_images_side_by_side(ax):
    from mpl_toolkits.axes_grid1 import make_axes_locatable

    divider = make_axes_locatable(ax)

    Z, extent = get_demo_image()
    ax2 = divider.append_axes("right", size="100%", pad=0.05)
    fig1 = ax.get_figure()
    fig1.add_axes(ax2)

    ax.imshow(Z, extent=extent)
    ax2.imshow(Z, extent=extent)
    ax2.yaxis.set_tick_params(labelleft=False)


def demo():
    fig = plt.figure(figsize=(6, 6))

    # PLOT 1
    # simple image & colorbar
    ax = fig.add_subplot(2, 2, 1)
    demo_simple_image(ax)

    # PLOT 2
    # image and colorbar with draw-time positioning -- a hard way
    demo_locatable_axes_hard(fig)

    # PLOT 3
    # image and colorbar with draw-time positioning -- an easy way
    ax = fig.add_subplot(2, 2, 3)
    demo_locatable_axes_easy(ax)

    # PLOT 4
    # two images side by side with fixed padding.
    ax = fig.add_subplot(2, 2, 4)
    demo_images_side_by_side(ax)

    plt.show()


demo()
Python 3.11.6 (matplotlib 3.7.1) では、下記のようなエラーがり、実行できない。
M:\______\demo_axes_divider_2.py:16: MatplotlibDeprecationWarning: In a future release, get_sample_data will automatically load numpy arrays. Set np_load to True to get the array and suppress this warning. Set asfileobj to False to get the path to the data file and suppress this warning. z = cbook.get_sample_data("axes_grid/bivariate_normal.npy") # 15x15 array Traceback (most recent call last): File "M:\______\demo_axes_divider_2.py", line 109, inPython 3.12.0 (matplotlib 3.8.1) では、正常に実行できる。demo() File "M:\______\demo_axes_divider_2.py", line 90, in demo demo_simple_image(ax) File "M:\______\demo_axes_divider_2.py", line 23, in demo_simple_image im = ax.imshow(Z, extent=extent) ^^^^^^^^^^^^^^^^^^^^^^^^^^^ File "C:\Users\______\AppData\Local\Programs \Python\Python311\Lib\site-packages\matplotlib\__init__.py", line 1459, in inner return func(ax, *map(sanitize_sequence, args), **kwargs) ^^^^^^^^^^^^^^^^^^^^^^^^^^^^^^^^^^^^^^^^^^^^^^^^^ File "C:\Users\______\AppData\Local\Programs \Python\Python311\Lib\site-packages\matplotlib\axes\_axes.py", line 5665, in imshow im.set_data(X) File "C:\Users\______\AppData\Local\Programs \Python\Python311\Lib\site-packages\matplotlib\image.py", line 701, in set_data raise TypeError("Image data of dtype {} cannot be converted to " TypeError: Image data of dtype object cannot be converted to float
- 参照ページ
axes_grid_Examples code: demo_axes_divider.py
demo-axes-divider-py
- リリースノート
- 2023/11/11 Ver=1.04 Python 3.12.0 (matplotlib 3.8.1)で確認
- 2023/11/11 Ver=1.04 Python 3.11.6 (matplotlib 3.7.1)で確認
- 2023/03/28 Ver=1.03 Python 3.11.2 で確認
- 2020/10/30 Ver=1.01 Python 3.7.8 で確認
- 2018/11/24 Ver=1.01 初版リリース
- 関連ページ