|
|
matplotlib api_Examples 24_mathtext_asarray. |
H.Kamifuji . |
- mathtext_asarray.py
この例は、LaTeX 文字列からイメージを作成する方法を示しています。
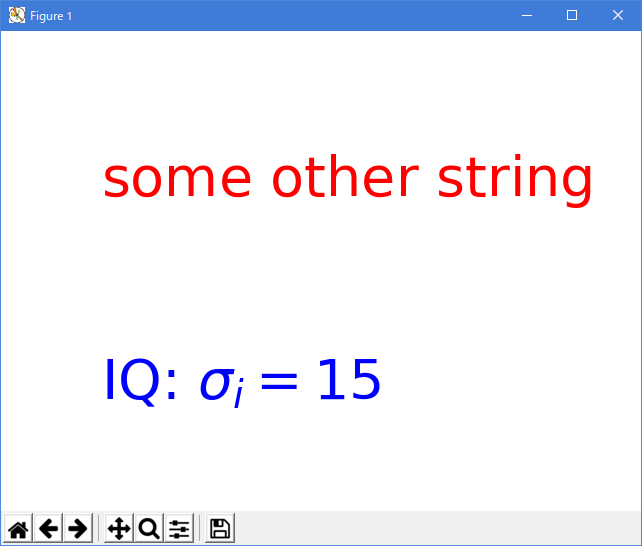
"""
===============================
A mathtext image as numpy array
===============================

This example shows how to make images from LaTeX strings.
"""

import matplotlib.mathtext as mathtext
import matplotlib.pyplot as plt
import matplotlib
matplotlib.rc('image', origin='upper')

parser = mathtext.MathTextParser("Bitmap")
parser.to_png('test2.png',
              r'$\left[\left\lfloor\frac{5}{\frac{\left(3\right)}{4}} '
              r'y\right)\right]$', color='green', fontsize=14, dpi=100)

rgba1, depth1 = parser.to_rgba(
    r'IQ: $\sigma_i=15$', color='blue', fontsize=20, dpi=200)
rgba2, depth2 = parser.to_rgba(
    r'some other string', color='red', fontsize=20, dpi=200)

fig = plt.figure()
fig.figimage(rgba1.astype(float)/255., 100, 100)
fig.figimage(rgba2.astype(float)/255., 100, 300)

plt.show()
- 実行結果( mathtext_asarray.png )
Python 3.11.2 見直しました。上記のコードでは、下記のエラーが発生します。
Traceback (most recent call last):
File "_:\mathtext_asarray.py", line 14, in
parser = mathtext.MathTextParser("Bitmap")
^^^^^^^^^^^^^^^^^^^^^^^^^^^^^^^^^
File "C:\Users\_____\AppData\Local\Programs\Python\Python311\Lib\site-packages\matplotlib\mathtext.py", line 206, in __init__
self._output_type = _api.check_getitem(
^^^^^^^^^^^^^^^^^^^
File "C:\Users\_____\AppData\Local\Programs\Python\Python311\Lib\site-packages\matplotlib\_api\__init__.py", line 192, in check_getitem
raise ValueError(
ValueError: 'bitmap' is not a valid value for output; supported values are 'path', 'agg', 'macosx'
"""
========
Mathtext
========

Use Matplotlib's internal LaTeX parser and layout engine.  For true LaTeX
rendering, see the text.usetex option.
"""

import matplotlib.pyplot as plt

fig, ax = plt.subplots()

ax.plot([1, 2, 3], label=r'$\sqrt{x^2}$')
ax.legend()

ax.set_xlabel(r'$\Delta_i^j$', fontsize=20)
ax.set_ylabel(r'$\Delta_{i+1}^j$', fontsize=20)
ax.set_title(r'$\Delta_i^j \hspace{0.4} \mathrm{versus} \hspace{0.4} '
             r'\Delta_{i+1}^j$', fontsize=20)

tex = r'$\mathcal{R}\prod_{i=\alpha_{i+1}}^\infty a_i\sin(2 \pi f x_i)$'
ax.text(1, 1.6, tex, fontsize=20, va='bottom')

fig.tight_layout()
plt.show()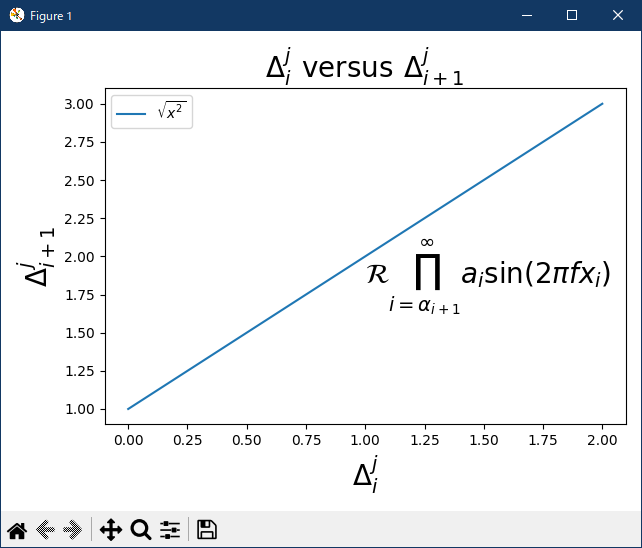
- 参照ページ
api example code: mathtext_asarray.py
mathtext-demo
- リリースノート
- 2023/11/10 Ver=1.04 Python 3.12.0 (matplotlib 3.8.1)で確認
- 2023/11/10 Ver=1.04 Python 3.11.6 (matplotlib 3.7.1)で確認
- 2023/03/28 Ver=1.03 Python 3.11.2 で確認
- 2020/10/29 Ver=1.01 Python 3.7.8 で確認
- 2018/11/23 Ver=1.01 初版リリース
- 関連ページ