|
|
matplotlib api_Examples 23_logo2. |
H.Kamifuji . |
- logo2.py
ロゴデザインの Tony Yu <tsyu80@gmail.com> に感謝します
"""
==========
matplotlib
==========

Thanks to Tony Yu <tsyu80@gmail.com> for the logo design
"""

import numpy as np
import matplotlib as mpl
import matplotlib.pyplot as plt
import matplotlib.cm as cm

mpl.rcParams['xtick.labelsize'] = 10
mpl.rcParams['ytick.labelsize'] = 12
mpl.rcParams['axes.edgecolor'] = 'gray'


axalpha = 0.05
figcolor = 'white'
dpi = 80
fig = plt.figure(figsize=(6, 1.1), dpi=dpi)
fig.figurePatch.set_edgecolor(figcolor)
fig.figurePatch.set_facecolor(figcolor)

def add_math_background():
    ax = fig.add_axes([0., 0., 1., 1.])

    text = []
    text.append(
        (r"$W^{3\beta}_{\delta_1 \rho_1 \sigma_2} = "
         r"U^{3\beta}_{\delta_1 \rho_1} + \frac{1}{8 \pi 2}"
         r"\int^{\alpha_2}_{\alpha_2} d \alpha^\prime_2 "
         r"\left[\frac{ U^{2\beta}_{\delta_1 \rho_1} - "
         r"\alpha^\prime_2U^{1\beta}_{\rho_1 \sigma_2} "
         r"}{U^{0\beta}_{\rho_1 \sigma_2}}\right]$", (0.7, 0.2), 20))
    text.append((r"$\frac{d\rho}{d t} + \rho \vec{v}\cdot\nabla\vec{v} "
                 r"= -\nabla p + \mu\nabla^2 \vec{v} + \rho \vec{g}$",
                 (0.35, 0.9), 20))
    text.append((r"$\int_{-\infty}^\infty e^{-x^2}dx=\sqrt{\pi}$",
                 (0.15, 0.3), 25))
    text.append((r"$F_G = G\frac{m_1m_2}{r^2}$",
                 (0.85, 0.7), 30))
    for eq, (x, y), size in text:
        ax.text(x, y, eq, ha='center', va='center', color="#11557c",
                alpha=0.25, transform=ax.transAxes, fontsize=size)
    ax.set_axis_off()
    return ax


def add_matplotlib_text(ax):
    ax.text(0.95, 0.5, 'matplotlib', color='#11557c', fontsize=65,
            ha='right', va='center', alpha=1.0, transform=ax.transAxes)


def add_polar_bar():
    ax = fig.add_axes([0.025, 0.075, 0.2, 0.85], projection='polar')

    ax.axesPatch.set_alpha(axalpha)
    ax.set_axisbelow(True)
    N = 7
    arc = 2. * np.pi
    theta = np.arange(0.0, arc, arc/N)
    radii = 10 * np.array([0.2, 0.6, 0.8, 0.7, 0.4, 0.5, 0.8])
    width = np.pi / 4 * np.array([0.4, 0.4, 0.6, 0.8, 0.2, 0.5, 0.3])
    bars = ax.bar(theta, radii, width=width, bottom=0.0)
    for r, bar in zip(radii, bars):
        bar.set_facecolor(cm.jet(r/10.))
        bar.set_alpha(0.6)

    for label in ax.get_xticklabels() + ax.get_yticklabels():
        label.set_visible(False)

    for line in ax.get_ygridlines() + ax.get_xgridlines():
        line.set_lw(0.8)
        line.set_alpha(0.9)
        line.set_ls('-')
        line.set_color('0.5')

    ax.set_yticks(np.arange(1, 9, 2))
    ax.set_rmax(9)


if __name__ == '__main__':
    main_axes = add_math_background()
    add_polar_bar()
    add_matplotlib_text(main_axes)
    plt.show()
- 実行結果( logo2.log )
当方の環境では、動作しない。下記の msg を見てください。
Traceback (most recent call last):
  File "logo2.py", line 23, in <module>
      fig.figurePatch.set_edgecolor(figcolor)
      AttributeError: 'Figure' object has no attribute 'figurePatch'
Python 3.11.2 見直しました。上記のコードでは、下記のエラーが発生します。
Traceback (most recent call last):
File "_:\logo2.py", line 23, in
fig.figurePatch.set_edgecolor(figcolor)
^^^^^^^^^^^^^^^
AttributeError: 'Figure' object has no attribute 'figurePatch'
matplotlib 内部のエラーのようです。matplotlib の改修(先祖帰りバグの改修)を待つしかない。
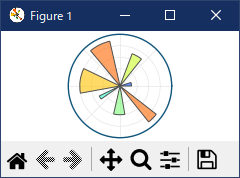
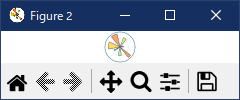
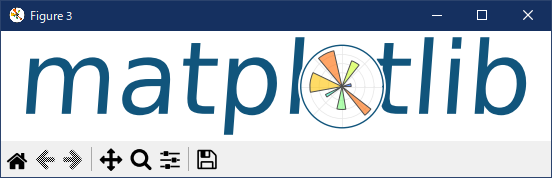
"""
===============
Matplotlib logo
===============

This example generates the current matplotlib logo.
"""

import matplotlib.pyplot as plt
import numpy as np

import matplotlib.cm as cm
import matplotlib.font_manager
from matplotlib.patches import PathPatch, Rectangle
from matplotlib.text import TextPath
import matplotlib.transforms as mtrans

MPL_BLUE = '#11557c'


def get_font_properties():
    # The original font is Calibri, if that is not installed, we fall back
    # to Carlito, which is metrically equivalent.
    if 'Calibri' in matplotlib.font_manager.findfont('Calibri:bold'):
        return matplotlib.font_manager.FontProperties(family='Calibri',
                                                      weight='bold')
    if 'Carlito' in matplotlib.font_manager.findfont('Carlito:bold'):
        print('Original font not found. Falling back to Carlito. '
              'The logo text will not be in the correct font.')
        return matplotlib.font_manager.FontProperties(family='Carlito',
                                                      weight='bold')
    print('Original font not found. '
          'The logo text will not be in the correct font.')
    return None


def create_icon_axes(fig, ax_position, lw_bars, lw_grid, lw_border, rgrid):
    """
    Create a polar axes containing the matplotlib radar plot.

    Parameters
    ----------
    fig : matplotlib.figure.Figure
        The figure to draw into.
    ax_position : (float, float, float, float)
        The position of the created Axes in figure coordinates as
        (x, y, width, height).
    lw_bars : float
        The linewidth of the bars.
    lw_grid : float
        The linewidth of the grid.
    lw_border : float
        The linewidth of the Axes border.
    rgrid : array-like
        Positions of the radial grid.

    Returns
    -------
    ax : matplotlib.axes.Axes
        The created Axes.
    """
    with plt.rc_context({'axes.edgecolor': MPL_BLUE,
                         'axes.linewidth': lw_border}):
        ax = fig.add_axes(ax_position, projection='polar')
        ax.set_axisbelow(True)

        N = 7
        arc = 2. * np.pi
        theta = np.arange(0.0, arc, arc / N)
        radii = np.array([2, 6, 8, 7, 4, 5, 8])
        width = np.pi / 4 * np.array([0.4, 0.4, 0.6, 0.8, 0.2, 0.5, 0.3])
        bars = ax.bar(theta, radii, width=width, bottom=0.0, align='edge',
                      edgecolor='0.3', lw=lw_bars)
        for r, bar in zip(radii, bars):
            color = *cm.jet(r / 10.)[:3], 0.6  # color from jet with alpha=0.6
            bar.set_facecolor(color)

        ax.tick_params(labelbottom=False, labeltop=False,
                       labelleft=False, labelright=False)

        ax.grid(lw=lw_grid, color='0.9')
        ax.set_rmax(9)
        ax.set_yticks(rgrid)

        # the actual visible background - extends a bit beyond the axis
        ax.add_patch(Rectangle((0, 0), arc, 9.58,
                               facecolor='white', zorder=0,
                               clip_on=False, in_layout=False))
        return ax


def create_text_axes(fig, height_px):
    """Create an Axes in *fig* that contains 'matplotlib' as Text."""
    ax = fig.add_axes((0, 0, 1, 1))
    ax.set_aspect("equal")
    ax.set_axis_off()

    path = TextPath((0, 0), "matplotlib", size=height_px * 0.8,
                    prop=get_font_properties())

    angle = 4.25  # degrees
    trans = mtrans.Affine2D().skew_deg(angle, 0)

    patch = PathPatch(path, transform=trans + ax.transData, color=MPL_BLUE,
                      lw=0)
    ax.add_patch(patch)
    ax.autoscale()


def make_logo(height_px, lw_bars, lw_grid, lw_border, rgrid, with_text=False):
    """
    Create a full figure with the Matplotlib logo.

    Parameters
    ----------
    height_px : int
        Height of the figure in pixel.
    lw_bars : float
        The linewidth of the bar border.
    lw_grid : float
        The linewidth of the grid.
    lw_border : float
        The linewidth of icon border.
    rgrid : sequence of float
        The radial grid positions.
    with_text : bool
        Whether to draw only the icon or to include 'matplotlib' as text.
    """
    dpi = 100
    height = height_px / dpi
    figsize = (5 * height, height) if with_text else (height, height)
    fig = plt.figure(figsize=figsize, dpi=dpi)
    fig.patch.set_alpha(0)

    if with_text:
        create_text_axes(fig, height_px)
    ax_pos = (0.535, 0.12, .17, 0.75) if with_text else (0.03, 0.03, .94, .94)
    ax = create_icon_axes(fig, ax_pos, lw_bars, lw_grid, lw_border, rgrid)

    return fig, ax

# %%
# A large logo:

make_logo(height_px=110, lw_bars=0.7, lw_grid=0.5, lw_border=1,
          rgrid=[1, 3, 5, 7])

# %%
# A small 32px logo:

make_logo(height_px=32, lw_bars=0.3, lw_grid=0.3, lw_border=0.3, rgrid=[5])

# %%
# A large logo including text, as used on the matplotlib website.

make_logo(height_px=110, lw_bars=0.7, lw_grid=0.5, lw_border=1,
          rgrid=[1, 3, 5, 7], with_text=True)

plt.show()
下記のメッセージがある。ロジックからは、Calibri と Carlito どちらのフォントも見つからないようだが?
findfont: Font family ['Carlito'] not found. Falling back to DejaVu Sans.
Original font not found. The logo text will not be in the correct font.
- 参照ページ
api example code: logo2.py
misc-logos2
- リリースノート
- 2023/11/10 Ver=1.04 Python 3.12.0 (matplotlib 3.8.1)で確認
- 2023/11/10 Ver=1.04 Python 3.11.6 (matplotlib 3.7.1)で確認
- 2023/03/28 Ver=1.03 Python 3.11.2 で確認
- 2020/10/29 Ver=1.01 Python 3.7.8 で確認
- 2018/11/23 Ver=1.01 初版リリース
- 関連ページ