|
|
matplotlib api_Examples 11_date_index_formatter. |
H.Kamifuji . |
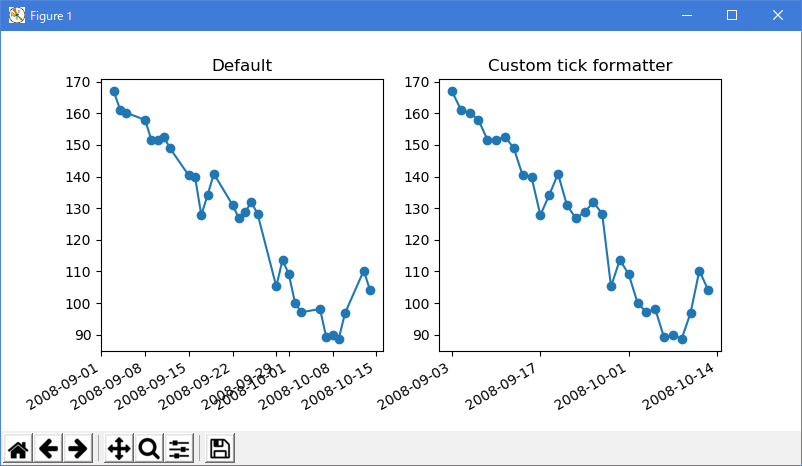
- date_index_formatter.py
例えば金融時系列などの時系列をプロットすると、データがない日、すなわち週末を除外したいことが多い。 下の例は、「インデックスフォーマッタ」を使って目的のプロットを実現する方法を示しています
この事例は、Windows10_1909 で Python 3.9.0 環境では、動作しません。( r = mlab.csv2rec(datafile) がデグレートしたのか? )
"""
=====================================
Custom tick formatter for time series
=====================================

When plotting time series, e.g., financial time series, one often wants
to leave out days on which there is no data, i.e. weekends.  The example
below shows how to use an 'index formatter' to achieve the desired plot
"""
from __future__ import print_function
import numpy as np
import matplotlib.pyplot as plt
import matplotlib.mlab as mlab
import matplotlib.cbook as cbook
import matplotlib.ticker as ticker

datafile = cbook.get_sample_data('aapl.csv', asfileobj=False)
print('loading %s' % datafile)
r = mlab.csv2rec(datafile)

r.sort()
r = r[-30:]  # get the last 30 days


# first we'll do it the default way, with gaps on weekends
fig, axes = plt.subplots(ncols=2, figsize=(8, 4))
ax = axes[0]
ax.plot(r.date, r.adj_close, 'o-')
ax.set_title("Default")
fig.autofmt_xdate()

# next we'll write a custom formatter
N = len(r)
ind = np.arange(N)  # the evenly spaced plot indices


def format_date(x, pos=None):
    thisind = np.clip(int(x + 0.5), 0, N - 1)
    return r.date[thisind].strftime('%Y-%m-%d')

ax = axes[1]
ax.plot(ind, r.adj_close, 'o-')
ax.xaxis.set_major_formatter(ticker.FuncFormatter(format_date))
ax.set_title("Custom tick formatter")
fig.autofmt_xdate()

plt.show()
- 実行結果( date_index_formatter.png )
Python 3.11.2 見直しました。上記のコードでは、下記のエラーが発生します。
TypeError: FigureBase.gca() got an unexpected keyword argument 'projection'
loading C:\Users\_____\AppData\Local\Programs\Python\Python311\Lib\site-packages\matplotlib\mpl-data\sample_data\aapl.csv
Traceback (most recent call last):
File "_:\date_index_formatter.py", line 19, in
r = mlab.csv2rec(datafile)
^^^^^^^^^^^^
AttributeError: module 'matplotlib.mlab' has no attribute 'csv2rec'
matplotlib 内部のエラーのようです。matplotlib の改修(先祖帰りバグの改修)を待つしかない。
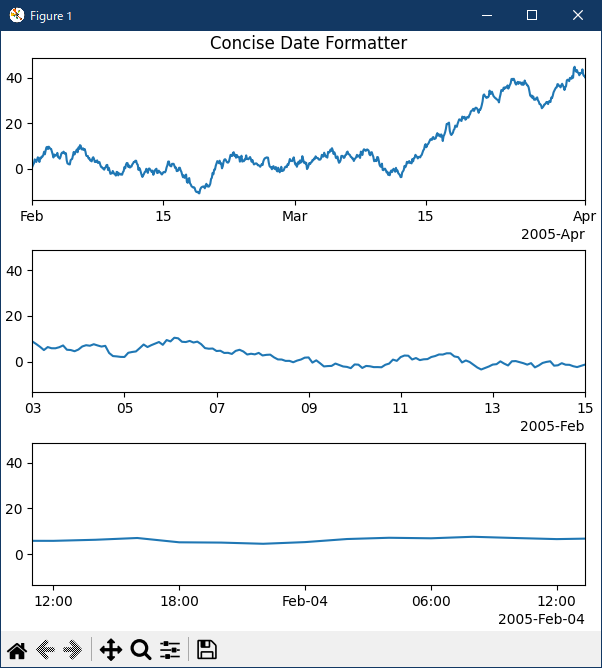
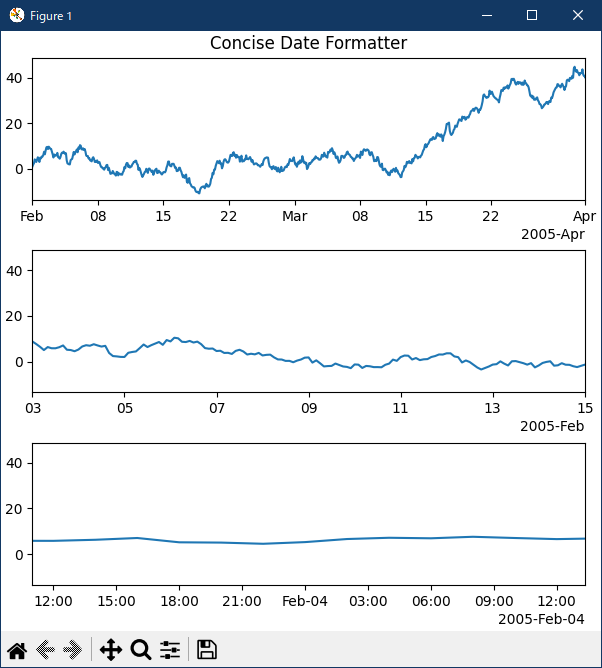
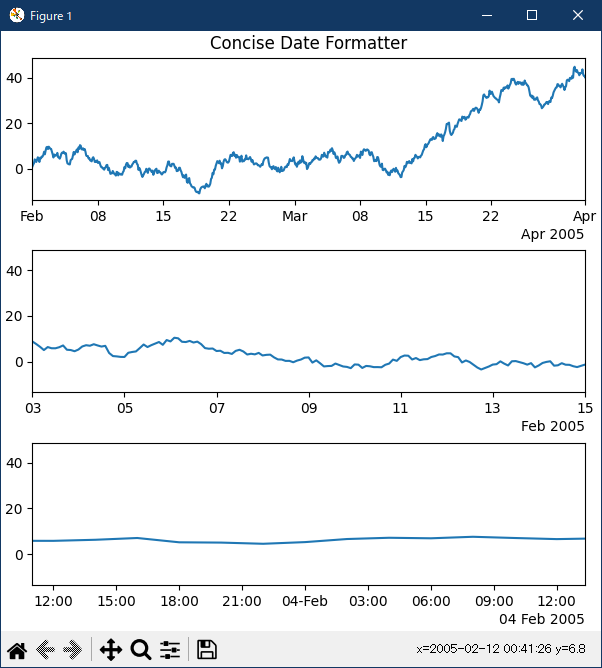
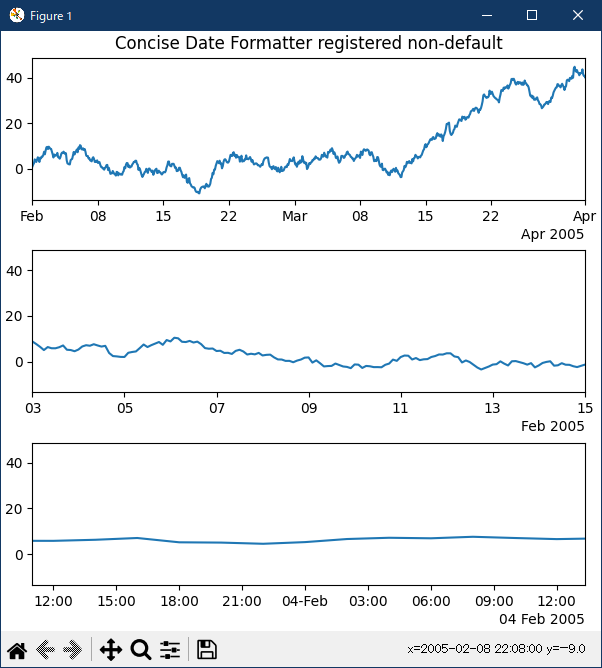
"""
================================================
Formatting date ticks using ConciseDateFormatter
================================================

Finding good tick values and formatting the ticks for an axis that
has date data is often a challenge.  `~.dates.ConciseDateFormatter` is
meant to improve the strings chosen for the ticklabels, and to minimize
the strings used in those tick labels as much as possible.

.. note::

    This formatter is a candidate to become the default date tick formatter
    in future versions of Matplotlib.  Please report any issues or
    suggestions for improvement to the GitHub repository or mailing list.

"""
import datetime

import matplotlib.pyplot as plt
import numpy as np

import matplotlib.dates as mdates

# %%
# First, the default formatter.

base = datetime.datetime(2005, 2, 1)
dates = [base + datetime.timedelta(hours=(2 * i)) for i in range(732)]
N = len(dates)
np.random.seed(19680801)
y = np.cumsum(np.random.randn(N))

fig, axs = plt.subplots(3, 1, layout='constrained', figsize=(6, 6))
lims = [(np.datetime64('2005-02'), np.datetime64('2005-04')),
        (np.datetime64('2005-02-03'), np.datetime64('2005-02-15')),
        (np.datetime64('2005-02-03 11:00'), np.datetime64('2005-02-04 13:20'))]
for nn, ax in enumerate(axs):
    ax.plot(dates, y)
    ax.set_xlim(lims[nn])
    # rotate_labels...
    for label in ax.get_xticklabels():
        label.set_rotation(40)
        label.set_horizontalalignment('right')
axs[0].set_title('Default Date Formatter')
plt.show()

# %%
# The default date formatter is quite verbose, so we have the option of
# using `~.dates.ConciseDateFormatter`, as shown below.  Note that
# for this example the labels do not need to be rotated as they do for the
# default formatter because the labels are as small as possible.

fig, axs = plt.subplots(3, 1, layout='constrained', figsize=(6, 6))
for nn, ax in enumerate(axs):
    locator = mdates.AutoDateLocator(minticks=3, maxticks=7)
    formatter = mdates.ConciseDateFormatter(locator)
    ax.xaxis.set_major_locator(locator)
    ax.xaxis.set_major_formatter(formatter)

    ax.plot(dates, y)
    ax.set_xlim(lims[nn])
axs[0].set_title('Concise Date Formatter')

plt.show()

# %%
# If all calls to axes that have dates are to be made using this converter,
# it is probably most convenient to use the units registry where you do
# imports:

import matplotlib.units as munits

converter = mdates.ConciseDateConverter()
munits.registry[np.datetime64] = converter
munits.registry[datetime.date] = converter
munits.registry[datetime.datetime] = converter

fig, axs = plt.subplots(3, 1, figsize=(6, 6), layout='constrained')
for nn, ax in enumerate(axs):
    ax.plot(dates, y)
    ax.set_xlim(lims[nn])
axs[0].set_title('Concise Date Formatter')

plt.show()

# %%
# Localization of date formats
# ============================
#
# Dates formats can be localized if the default formats are not desirable by
# manipulating one of three lists of strings.
#
# The ``formatter.formats`` list of formats is for the normal tick labels,
# There are six levels: years, months, days, hours, minutes, seconds.
# The ``formatter.offset_formats`` is how the "offset" string on the right
# of the axis is formatted.  This is usually much more verbose than the tick
# labels. Finally, the ``formatter.zero_formats`` are the formats of the
# ticks that are "zeros".  These are tick values that are either the first of
# the year, month, or day of month, or the zeroth hour, minute, or second.
# These are usually the same as the format of
# the ticks a level above.  For example if the axis limits mean the ticks are
# mostly days, then we label 1 Mar 2005 simply with a "Mar".  If the axis
# limits are mostly hours, we label Feb 4 00:00 as simply "Feb-4".
#
# Note that these format lists can also be passed to `.ConciseDateFormatter`
# as optional keyword arguments.
#
# Here we modify the labels to be "day month year", instead of the ISO
# "year month day":

fig, axs = plt.subplots(3, 1, layout='constrained', figsize=(6, 6))

for nn, ax in enumerate(axs):
    locator = mdates.AutoDateLocator()
    formatter = mdates.ConciseDateFormatter(locator)
    formatter.formats = ['%y',  # ticks are mostly years
                         '%b',       # ticks are mostly months
                         '%d',       # ticks are mostly days
                         '%H:%M',    # hrs
                         '%H:%M',    # min
                         '%S.%f', ]  # secs
    # these are mostly just the level above...
    formatter.zero_formats = [''] + formatter.formats[:-1]
    # ...except for ticks that are mostly hours, then it is nice to have
    # month-day:
    formatter.zero_formats[3] = '%d-%b'

    formatter.offset_formats = ['',
                                '%Y',
                                '%b %Y',
                                '%d %b %Y',
                                '%d %b %Y',
                                '%d %b %Y %H:%M', ]
    ax.xaxis.set_major_locator(locator)
    ax.xaxis.set_major_formatter(formatter)

    ax.plot(dates, y)
    ax.set_xlim(lims[nn])
axs[0].set_title('Concise Date Formatter')

plt.show()

# %%
# Registering a converter with localization
# =========================================
#
# `.ConciseDateFormatter` doesn't have rcParams entries, but localization can
# be accomplished by passing keyword arguments to `.ConciseDateConverter` and
# registering the datatypes you will use with the units registry:

import datetime

formats = ['%y',          # ticks are mostly years
           '%b',     # ticks are mostly months
           '%d',     # ticks are mostly days
           '%H:%M',  # hrs
           '%H:%M',  # min
           '%S.%f', ]  # secs
# these can be the same, except offset by one level....
zero_formats = [''] + formats[:-1]
# ...except for ticks that are mostly hours, then it's nice to have month-day
zero_formats[3] = '%d-%b'
offset_formats = ['',
                  '%Y',
                  '%b %Y',
                  '%d %b %Y',
                  '%d %b %Y',
                  '%d %b %Y %H:%M', ]

converter = mdates.ConciseDateConverter(
    formats=formats, zero_formats=zero_formats, offset_formats=offset_formats)

munits.registry[np.datetime64] = converter
munits.registry[datetime.date] = converter
munits.registry[datetime.datetime] = converter

fig, axs = plt.subplots(3, 1, layout='constrained', figsize=(6, 6))
for nn, ax in enumerate(axs):
    ax.plot(dates, y)
    ax.set_xlim(lims[nn])
axs[0].set_title('Concise Date Formatter registered non-default')

plt.show()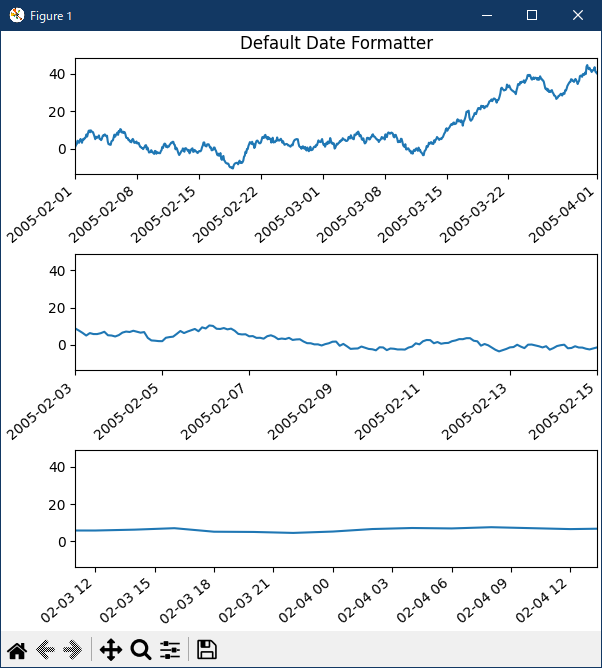
- 参照ページ
api example code: date_index_formatter.py
ticks-date-concise-formatter
- リリースノート
- 2023/11/09 Ver=1.04 Python 3.12.0 (matplotlib 3.8.1)で確認
- 2023/11/09 Ver=1.04 Python 3.11.6 (matplotlib 3.7.1)で確認
- 2023/03/28 Ver=1.03 Python 3.11.2 で確認
- 2020/10/29 Ver=1.01 Python 3.7.8 で確認
- 2018/11/22 Ver=1.01 初版リリース
- 関連ページ