|
|
matplotlib api_Examples 10_date_demo. |
H.Kamifuji . |
- date_demo.py
matplotlib で日付チックロケータとフォーマッタを使って日付プロットを作成する方法を示します。 メジャーおよびマイナーチックの制御の詳細については、major_minor_demo1.py を参照してください。
すべての matplotlib の日付プロットは、日付インスタンスを 0001-01-01 UTC 以降の日に変換することによって行われます。 変換、ティックの配置と書式設定は裏で行われるので、これはあなたにとって最も透過的です。 dates モジュールは、複数のコンバータ関数 date2num と num2date を提供します
この事例は、Windows10_1909 で Python 3.9.0 環境では、動作しません。( datafile = cbook.get_sample_data('goog.npy') がデグレートしたのか? )
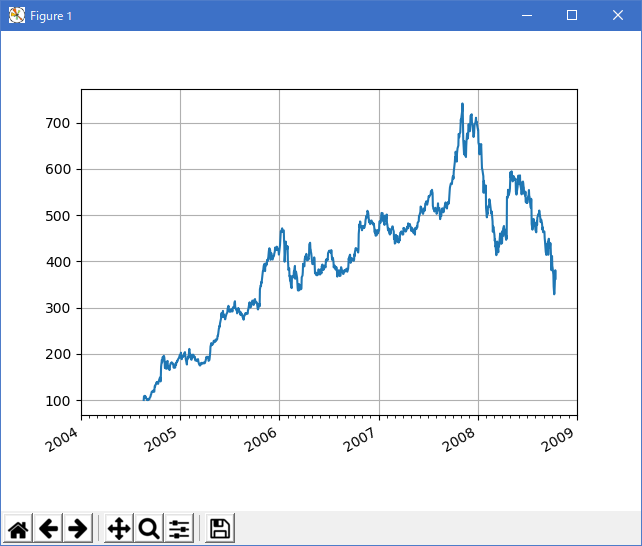
"""
================
Date tick labels
================

Show how to make date plots in matplotlib using date tick locators and
formatters.  See major_minor_demo1.py for more information on
controlling major and minor ticks

All matplotlib date plotting is done by converting date instances into
days since the 0001-01-01 UTC.  The conversion, tick locating and
formatting is done behind the scenes so this is most transparent to
you.  The dates module provides several converter functions date2num
and num2date

"""
import datetime
import numpy as np
import matplotlib.pyplot as plt
import matplotlib.dates as mdates
import matplotlib.cbook as cbook

years = mdates.YearLocator()   # every year
months = mdates.MonthLocator()  # every month
yearsFmt = mdates.DateFormatter('%Y')

# load a numpy record array from yahoo csv data with fields date,
# open, close, volume, adj_close from the mpl-data/example directory.
# The record array stores python datetime.date as an object array in
# the date column
datafile = cbook.get_sample_data('goog.npy')
try:
    # Python3 cannot load python2 .npy files with datetime(object) arrays
    # unless the encoding is set to bytes. However this option was
    # not added until numpy 1.10 so this example will only work with
    # python 2 or with numpy 1.10 and later.
    r = np.load(datafile, encoding='bytes').view(np.recarray)
except TypeError:
    r = np.load(datafile).view(np.recarray)

fig, ax = plt.subplots()
ax.plot(r.date, r.adj_close)


# format the ticks
ax.xaxis.set_major_locator(years)
ax.xaxis.set_major_formatter(yearsFmt)
ax.xaxis.set_minor_locator(months)

datemin = datetime.date(r.date.min().year, 1, 1)
datemax = datetime.date(r.date.max().year + 1, 1, 1)
ax.set_xlim(datemin, datemax)


# format the coords message box
def price(x):
    return '$%1.2f' % x
ax.format_xdata = mdates.DateFormatter('%Y-%m-%d')
ax.format_ydata = price
ax.grid(True)

# rotates and right aligns the x labels, and moves the bottom of the
# axes up to make room for them
fig.autofmt_xdate()

plt.show()
- 実行結果( date_demo.png )
Python 3.11.2 見直しました。上記のコードでは、下記のエラーが発生します。
_:\date_demo.py:31: MatplotlibDeprecationWarning: In a future release, get_sample_data will automatically load numpy arrays. Set np_load to True to get the array and suppress this warning. Set asfileobj to False to get the path to the data file and suppress this warning.
datafile = cbook.get_sample_data('M:\\usr\\rehome10\\Python\Py-Support\\54_api_Examples_agg_oo\\10_date_demo\\goog.npy')
Traceback (most recent call last):
File "_:\date_demo.py", line 39, in
r = np.load(datafile, encoding='bytes').view(np.recarray)
^^^^^^^^^^^^^^^^^^^^^^^^^^^^^^^^^^^
File "C:\Users\_____\AppData\Local\Programs\Python\Python311\Lib\site-packages\numpy\lib\npyio.py", line 432, in load
return format.read_array(fid, allow_pickle=allow_pickle,
^^^^^^^^^^^^^^^^^^^^^^^^^^^^^^^^^^^^^^^^^^^^^^^^^
File "C:\Users\_____\AppData\Local\Programs\Python\Python311\Lib\site-packages\numpy\lib\format.py", line 787, in read_array
raise ValueError("Object arrays cannot be loaded when "
ValueError: Object arrays cannot be loaded when allow_pickle=False
matplotlib 内部のエラーのようです。matplotlib の改修(先祖帰りバグの改修)を待つしかない。
import matplotlib.pyplot as plt

import matplotlib.cbook as cbook
import matplotlib.dates as mdates

# Load a numpy record array from yahoo csv data with fields date, open, high,
# low, close, volume, adj_close from the mpl-data/sample_data directory. The
# record array stores the date as an np.datetime64 with a day unit ('D') in
# the date column.
data = cbook.get_sample_data('goog.npz')['price_data']

fig, axs = plt.subplots(3, 1, figsize=(6.4, 7), layout='constrained')
# common to all three:
for ax in axs:
    ax.plot('date', 'adj_close', data=data)
    # Major ticks every half year, minor ticks every month,
    ax.xaxis.set_major_locator(mdates.MonthLocator(bymonth=(1, 7)))
    ax.xaxis.set_minor_locator(mdates.MonthLocator())
    ax.grid(True)
    ax.set_ylabel(r'Price [\$]')

# different formats:
ax = axs[0]
ax.set_title('DefaultFormatter', loc='left', y=0.85, x=0.02, fontsize='medium')

ax = axs[1]
ax.set_title('ConciseFormatter', loc='left', y=0.85, x=0.02, fontsize='medium')
ax.xaxis.set_major_formatter(
    mdates.ConciseDateFormatter(ax.xaxis.get_major_locator()))

ax = axs[2]
ax.set_title('Manual DateFormatter', loc='left', y=0.85, x=0.02,
             fontsize='medium')
# Text in the x-axis will be displayed in 'YYYY-mm' format.
ax.xaxis.set_major_formatter(mdates.DateFormatter('%Y-%b'))
# Rotates and right-aligns the x labels so they don't crowd each other.
for label in ax.get_xticklabels(which='major'):
    label.set(rotation=30, horizontalalignment='right')

plt.show()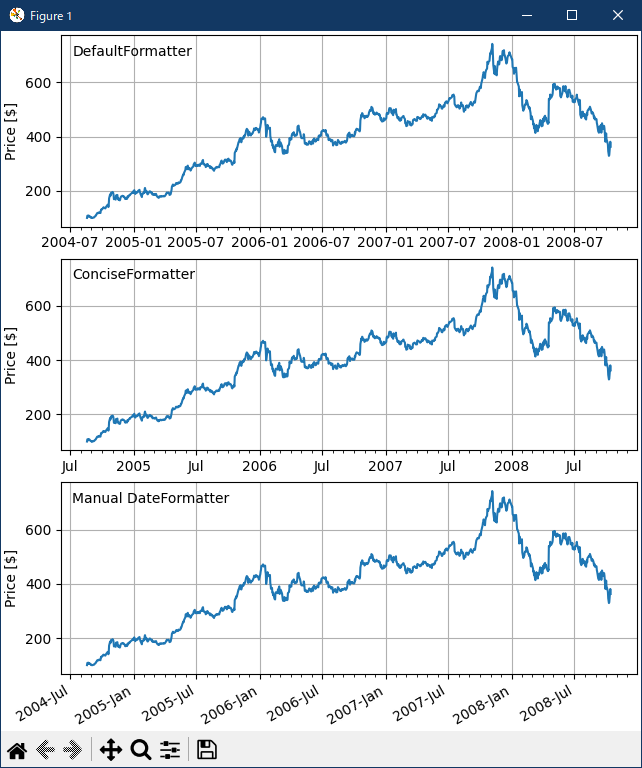
- 参照ページ
api example code: date_demo.py
text-labels-and-annotations-date
- リリースノート
- 2023/11/09 Ver=1.04 Python 3.12.0 (matplotlib 3.8.1)で確認
- 2023/11/09 Ver=1.04 Python 3.11.6 (matplotlib 3.7.1)で確認
- 2023/03/28 Ver=1.03 Python 3.11.2 で確認
- 2020/10/29 Ver=1.01 Python 3.7.8 で確認
- 2018/11/22 Ver=1.01 初版リリース
- 関連ページ