|
|
matplotlib Generate polygons to fill under 3D line graph. |
H.Kamifuji . |
- Generate polygons to fill under 3D line graph
線グラフの下のスペースを埋めるポリゴンを作成する方法を示します。 この例では、ポリゴンは半透明で、「ギザギザのステンドグラス」エフェクトを作成します。
# This import registers the 3D projection, but is otherwise unused.
from mpl_toolkits.mplot3d import Axes3D  # noqa: F401 unused import

from matplotlib.collections import PolyCollection
import matplotlib.pyplot as plt
from matplotlib import colors as mcolors
import numpy as np

# Fixing random state for reproducibility
np.random.seed(19680801)


def cc(arg):
    '''
    Shorthand to convert 'named' colors to rgba format at 60% opacity.
    '''
    return mcolors.to_rgba(arg, alpha=0.6)


def polygon_under_graph(xlist, ylist):
    '''
    Construct the vertex list which defines the polygon filling the space under
    the (xlist, ylist) line graph.  Assumes the xs are in ascending order.
    '''
    return [(xlist[0], 0.), *zip(xlist, ylist), (xlist[-1], 0.)]


fig = plt.figure()
ax = fig.gca(projection='3d')

# Make verts a list, verts[i] will be a list of (x,y) pairs defining polygon i
verts = []

# Set up the x sequence
xs = np.linspace(0., 10., 26)

# The ith polygon will appear on the plane y = zs[i]
zs = range(4)

for i in zs:
    ys = np.random.rand(len(xs))
    verts.append(polygon_under_graph(xs, ys))

poly = PolyCollection(verts, facecolors=[cc('r'), cc('g'), cc('b'), cc('y')])
ax.add_collection3d(poly, zs=zs, zdir='y')

ax.set_xlabel('X')
ax.set_ylabel('Y')
ax.set_zlabel('Z')
ax.set_xlim(0, 10)
ax.set_ylim(-1, 4)
ax.set_zlim(0, 1)

plt.show()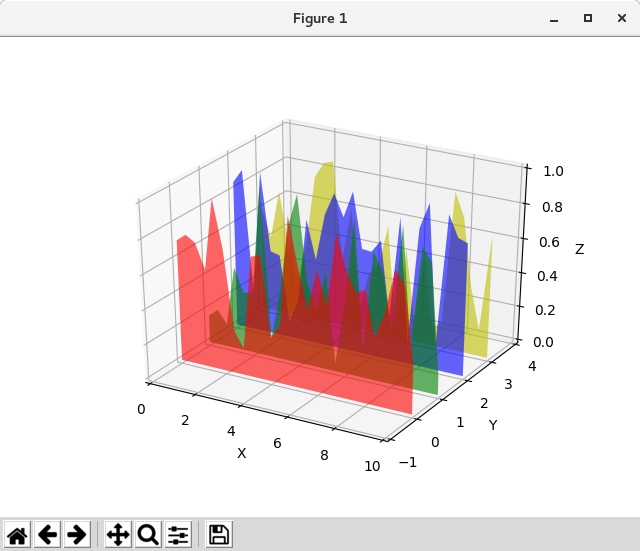

Python 3.11.2 見直しました。上記のコードでは、下記のエラーが発生します。
TypeError: FigureBase.gca() got an unexpected keyword argument 'projection'
from matplotlib.collections import PolyCollection import matplotlib.pyplot as plt import math import numpy as np # Fixing random state for reproducibility np.random.seed(19680801) def polygon_under_graph(x, y): """ Construct the vertex list which defines the polygon filling the space under the (x, y) line graph. This assumes x is in ascending order. """ return [(x[0], 0.), *zip(x, y), (x[-1], 0.)] ax = plt.figure().add_subplot(projection='3d') x = np.linspace(0., 10., 31) lambdas = range(1, 9) # verts[i] is a list of (x, y) pairs defining polygon i. gamma = np.vectorize(math.gamma) verts = [polygon_under_graph(x, l**x * np.exp(-l) / gamma(x + 1)) for l in lambdas] facecolors = plt.colormaps['viridis_r'](np.linspace(0, 1, len(verts))) poly = PolyCollection(verts, facecolors=facecolors, alpha=.7) ax.add_collection3d(poly, zs=lambdas, zdir='y') ax.set(xlim=(0, 10), ylim=(1, 9), zlim=(0, 0.35), xlabel='x', ylabel=r'$\lambda$', zlabel='probability') plt.show() 
- 参照ページ
Generate polygons to fill under 3D line graph
- リリースノート
- 2023/03/13 Ver=1.03 Python 3.11.2 で確認
- 2020/10/28 Ver=1.01 Python 3.7.8 で確認
- 2018/11/08 Ver=1.01 初版リリース
- 関連ページ