|
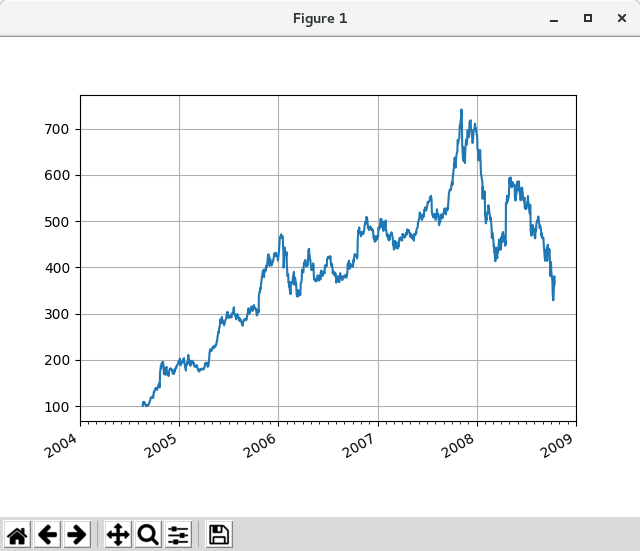
matplotlib で日付チックロケータとフォーマッタを使って日付プロットを作成する方法を示します。 メジャーおよびマイナーチックの制御の詳細については、major_minor_demo1.py を参照してください。
すべての matplotlib 日付プロットは、日付インスタンスを 0001-01-01 00:00:00 UTC プラス 1 日(歴史上の理由から)から日数に変換することによって行われます。 変換、ティックの配置と書式設定は裏で行われるので、これはあなたにとって最も透過的です。 dates モジュールはいくつかの変換関数 matplotlib.dates.date2num と matplotlib.dates.num2date を提供します。 これらは、datetime.datetime オブジェクトと numpy.datetime64 オブジェクトの間で変換できます。
import numpy as np
import matplotlib.pyplot as plt
import matplotlib.dates as mdates
import matplotlib.cbook as cbook
years = mdates.YearLocator() # every year
months = mdates.MonthLocator() # every month
yearsFmt = mdates.DateFormatter('%Y')
# Load a numpy record array from yahoo csv data with fields date, open, close,
# volume, adj_close from the mpl-data/example directory. The record array
# stores the date as an np.datetime64 with a day unit ('D') in the date column.
with cbook.get_sample_data('goog.npz') as datafile:
r = np.load(datafile)['price_data'].view(np.recarray)
fig, ax = plt.subplots()
ax.plot(r.date, r.adj_close)
# format the ticks
ax.xaxis.set_major_locator(years)
ax.xaxis.set_major_formatter(yearsFmt)
ax.xaxis.set_minor_locator(months)
# round to nearest years...
datemin = np.datetime64(r.date[0], 'Y')
datemax = np.datetime64(r.date[-1], 'Y') + np.timedelta64(1, 'Y')
ax.set_xlim(datemin, datemax)
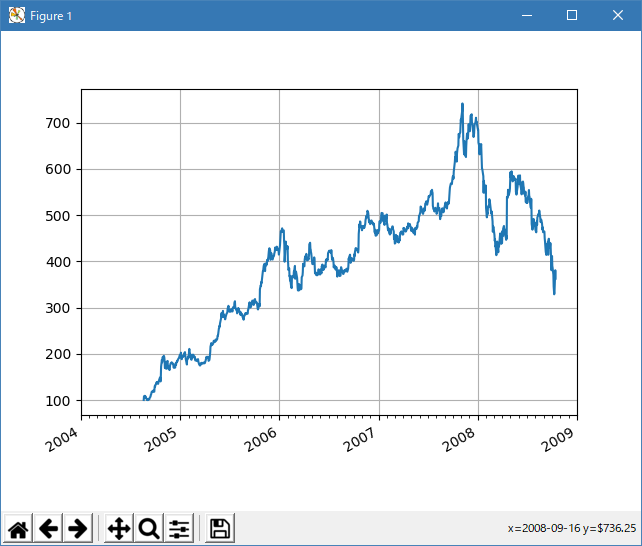
# format the coords message box
def price(x):
return '$%1.2f' % x
ax.format_xdata = mdates.DateFormatter('%Y-%m-%d')
ax.format_ydata = price
ax.grid(True)
# rotates and right aligns the x labels, and moves the bottom of the
# axes up to make room for them
fig.autofmt_xdate()
plt.show()
Python 3.12.0 では、下記のようなエラーで、実行できない。
Traceback (most recent call last):
  File "E:\______\Date_handling_01.py", line 14, in
    r = np.load(datafile)['price_data'].view(np.recarray)
        ^^^^^^^^^^^^^^^^^
  File "C:\Users\______\AppData\Roaming\Python\Python312\site-packages\numpy\lib\npyio.py",
       line 427, in load
    fid = stack.enter_context(open(os_fspath(file), "rb"))
                                   ^^^^^^^^^^^^^^^
TypeError: expected str, bytes or os.PathLike object, not NpzFile
open に対するセキュリティ対策が適用されてない。!?
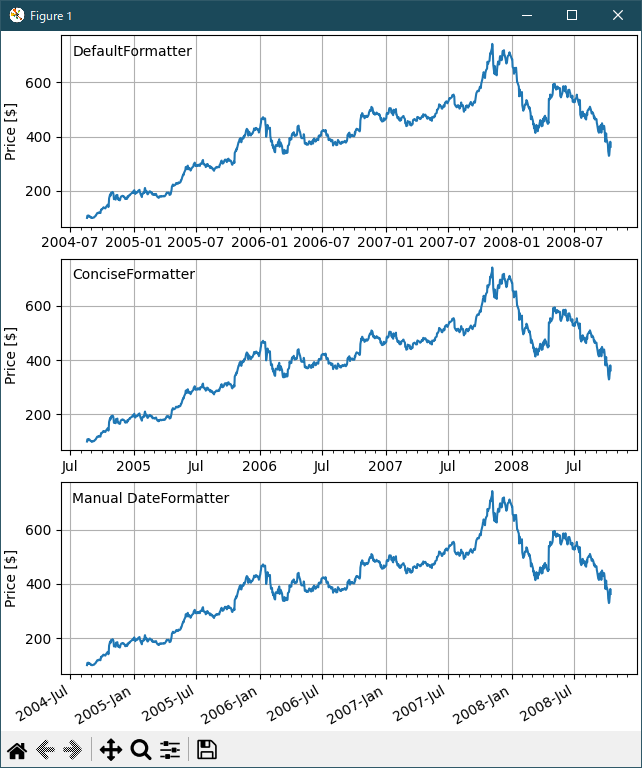
Python 3.11.6 (matplotlib 3.7.1) 及び Python 3.12.0 (matplotlib 3.8.1) で、見直し中、新しいサンプル(text-labels-and-annotations-date-py) を見つけ、下記のコードで、正常に実行できました。
import matplotlib.pyplot as plt

import matplotlib.cbook as cbook
import matplotlib.dates as mdates

# Load a numpy record array from yahoo csv data with fields date, open, high,
# low, close, volume, adj_close from the mpl-data/sample_data directory. The
# record array stores the date as an np.datetime64 with a day unit ('D') in
# the date column.
data = cbook.get_sample_data('goog.npz')['price_data']

fig, axs = plt.subplots(3, 1, figsize=(6.4, 7), layout='constrained')
# common to all three:
for ax in axs:
    ax.plot('date', 'adj_close', data=data)
    # Major ticks every half year, minor ticks every month,
    ax.xaxis.set_major_locator(mdates.MonthLocator(bymonth=(1, 7)))
    ax.xaxis.set_minor_locator(mdates.MonthLocator())
    ax.grid(True)
    ax.set_ylabel(r'Price [\$]')

# different formats:
ax = axs[0]
ax.set_title('DefaultFormatter', loc='left', y=0.85, x=0.02, fontsize='medium')

ax = axs[1]
ax.set_title('ConciseFormatter', loc='left', y=0.85, x=0.02, fontsize='medium')
ax.xaxis.set_major_formatter(
    mdates.ConciseDateFormatter(ax.xaxis.get_major_locator()))

ax = axs[2]
ax.set_title('Manual DateFormatter', loc='left', y=0.85, x=0.02,
             fontsize='medium')
# Text in the x-axis will be displayed in 'YYYY-mm' format.
ax.xaxis.set_major_formatter(mdates.DateFormatter('%Y-%b'))
# Rotates and right-aligns the x labels so they don't crowd each other.
for label in ax.get_xticklabels(which='major'):
    label.set(rotation=30, horizontalalignment='right')

plt.show()
Python 3.11.6 (matplotlib 3.7.1) では、下記のようなエラーがあり、実行できない。
M:\______\16_Date_handling\Date_handling_02.py:10:
    MatplotlibDeprecationWarning: In a future release, get_sample_data will
    automatically load numpy arrays.  Set np_load to True to get the array
    and suppress this warning.  Set asfileobj to False to get the path to
    the data file and suppress this warning.
  data = cbook.get_sample_data('goog.npz')['price_data']
Traceback (most recent call last):
  File "M:\______\16_Date_handling\Date_handling_02.py", line 10, in
    data = cbook.get_sample_data('goog.npz')['price_data']
           ~~~~~~~~~~~~~~~~~~~~~~~~~~~~~~~~~^^^^^^^^^^^^^^
TypeError: '_io.BufferedReader' object is not subscriptable
Python 3.12.0 (matplotlib 3.8.1) では、正常に、実行できる。
|