|
デモ塗りつぶしプロット。
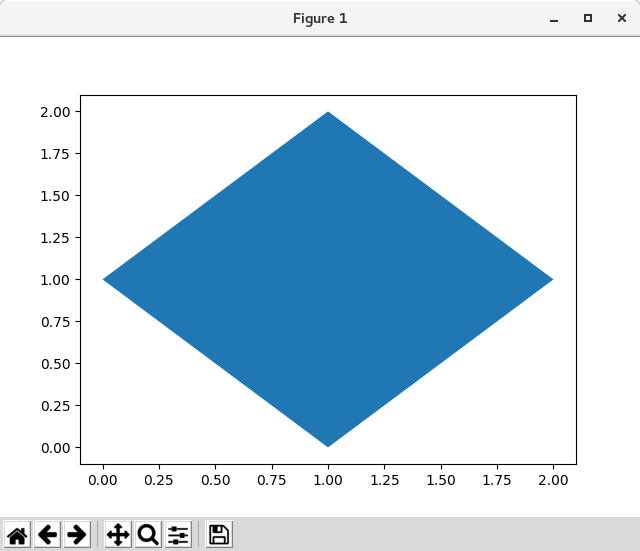
まず、ユーザーが matplotlib を使って作ることができる最も基本的な塗りつぶしプロット:
import numpy as np
import matplotlib.pyplot as plt

x = [0, 1, 2, 1]
y = [1, 2, 1, 0]

fig, ax = plt.subplots()
ax.fill(x, y)
plt.show()
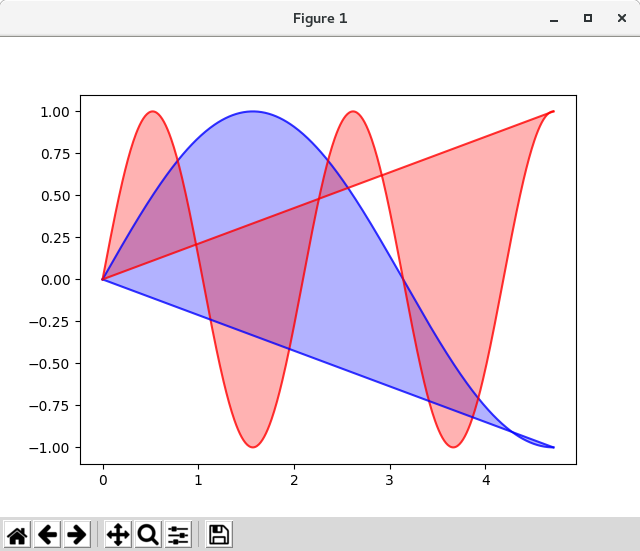
次に、いくつかのオプション機能が追加されました。
- 1 つのコマンドで複数の曲線を作成する。
- 塗りつぶしの色を設定する。
- 不透明度(アルファ値)の設定。
import numpy as np
import matplotlib.pyplot as plt

x = np.linspace(0, 1.5 * np.pi, 500)
y1 = np.sin(x)
y2 = np.sin(3 * x)

fig, ax = plt.subplots()

ax.fill(x, y1, 'b', x, y2, 'r', alpha=0.3)

# Outline of the region we've filled in
ax.plot(x, y1, c='b', alpha=0.8)
ax.plot(x, y2, c='r', alpha=0.8)
ax.plot([x[0], x[-1]], [y1[0], y1[-1]], c='b', alpha=0.8)
ax.plot([x[0], x[-1]], [y2[0], y2[-1]], c='r', alpha=0.8)

plt.show()
|