|
さまざまなマーカーの色とサイズの散布図のデモ。
import numpy as np
import matplotlib.pyplot as plt
import matplotlib.cbook as cbook
# Load a numpy record array from yahoo csv data with fields date, open, close,
# volume, adj_close from the mpl-data/example directory. The record array
# stores the date as an np.datetime64 with a day unit ('D') in the date column.
with cbook.get_sample_data('goog.npz') as datafile:
price_data = np.load(datafile)['price_data'].view(np.recarray)
price_data = price_data[-250:] # get the most recent 250 trading days
delta1 = np.diff(price_data.adj_close) / price_data.adj_close[:-1]
# Marker size in units of points^2
volume = (15 * price_data.volume[:-2] / price_data.volume[0])**2
close = 0.003 * price_data.close[:-2] / 0.003 * price_data.open[:-2]
fig, ax = plt.subplots()
ax.scatter(delta1[:-1], delta1[1:], c=close, s=volume, alpha=0.5)
ax.set_xlabel(r'$\Delta_i$', fontsize=15)
ax.set_ylabel(r'$\Delta_{i+1}$', fontsize=15)
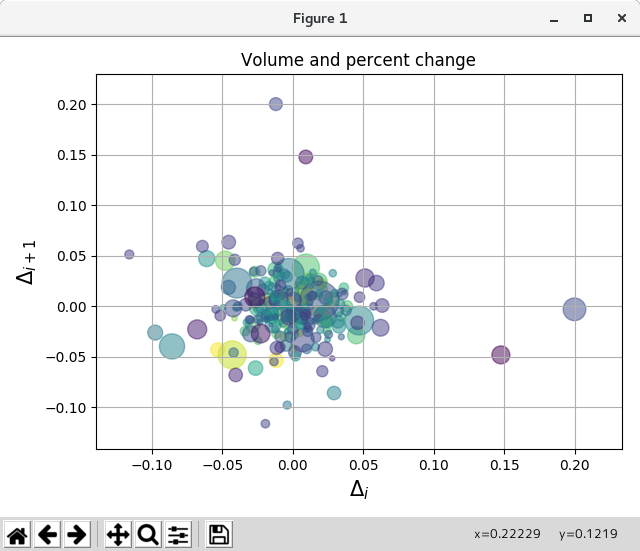
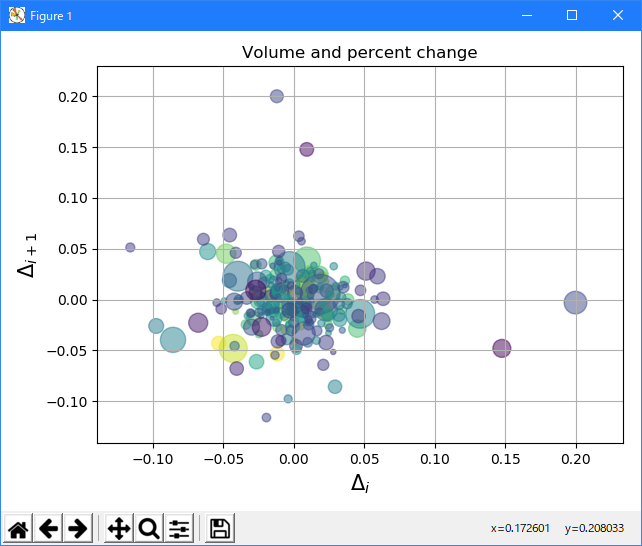
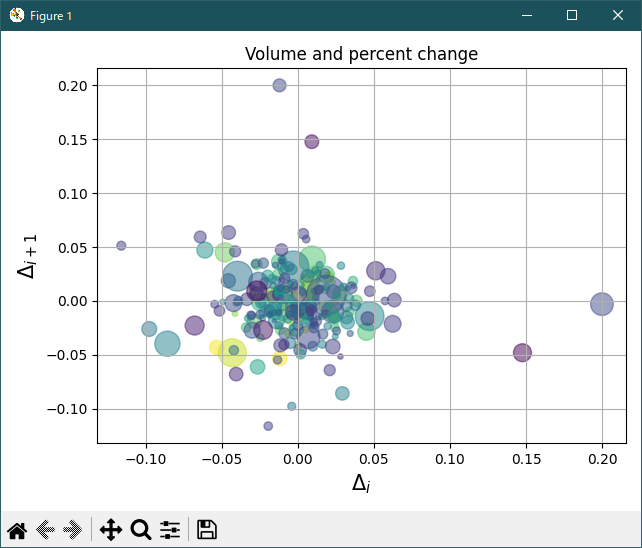
ax.set_title('Volume and percent change')
ax.grid(True)
fig.tight_layout()
plt.show()
Python 3.12.0 では、下記のようなエラーで、実行できない。
Traceback (most recent call last):
  File "E:\______\Scatter_plots_01.py", line 9, in
    price_data = np.load(datafile)['price_data'].view(np.recarray)
                 ^^^^^^^^^^^^^^^^^
  File "C:\Users\______\AppData\Roaming\Python\Python312\site-packages\numpy\lib\npyio.py",
      line 427, in load
    fid = stack.enter_context(open(os_fspath(file), "rb"))
                                   ^^^^^^^^^^^^^^^
TypeError: expected str, bytes or os.PathLike object, not NpzFile
open に対するセキュリティ対策が適用されてない。!?
Python 3.11.6 (matplotlib 3.7.1) 及び Python 3.12.0 (matplotlib 3.8.1) で、見直し中、新しいサンプル(scatter-demo2-py) を見つけ、下記のコードで、正常に実行できました。
import matplotlib.pyplot as plt
import numpy as np

import matplotlib.cbook as cbook

# Load a numpy record array from yahoo csv data with fields date, open, high,
# low, close, volume, adj_close from the mpl-data/sample_data directory. The
# record array stores the date as an np.datetime64 with a day unit ('D') in
# the date column.
price_data = cbook.get_sample_data('goog.npz')['price_data']
price_data = price_data[-250:]  # get the most recent 250 trading days

delta1 = np.diff(price_data["adj_close"]) / price_data["adj_close"][:-1]

# Marker size in units of points^2
volume = (15 * price_data["volume"][:-2] / price_data["volume"][0])**2
close = 0.003 * price_data["close"][:-2] / 0.003 * price_data["open"][:-2]

fig, ax = plt.subplots()
ax.scatter(delta1[:-1], delta1[1:], c=close, s=volume, alpha=0.5)

ax.set_xlabel(r'$\Delta_i$', fontsize=15)
ax.set_ylabel(r'$\Delta_{i+1}$', fontsize=15)
ax.set_title('Volume and percent change')

ax.grid(True)
fig.tight_layout()

plt.show()
Python 3.11.6 (matplotlib 3.7.1) では、下記のようなエラーがあり、実行できない。
M:\______\13_Scatter_plots\Scatter_plots_02.py:10:
    MatplotlibDeprecationWarning: In a future release, get_sample_data will
    automatically load numpy arrays.  Set np_load to True to get the array
    and suppress this warning.  Set asfileobj to False to get the path to
    the data file and suppress this warning.
  price_data = cbook.get_sample_data('goog.npz')['price_data']
Traceback (most recent call last):
  File "M:\______\13_Scatter_plots\Scatter_plots_02.py", line 10, in
    price_data = cbook.get_sample_data('goog.npz')['price_data']
                 ~~~~~~~~~~~~~~~~~~~~~~~~~~~~~~~~~^^^^^^^^^^^^^^
TypeError: '_io.BufferedReader' object is not subscriptable
Python 3.12.0 (matplotlib 3.8.1) では、正常に、実行できる。
|